Korkut Kaynardag
Probability, statistics and estimation

74 slidesDownload PDF 2.52 MB

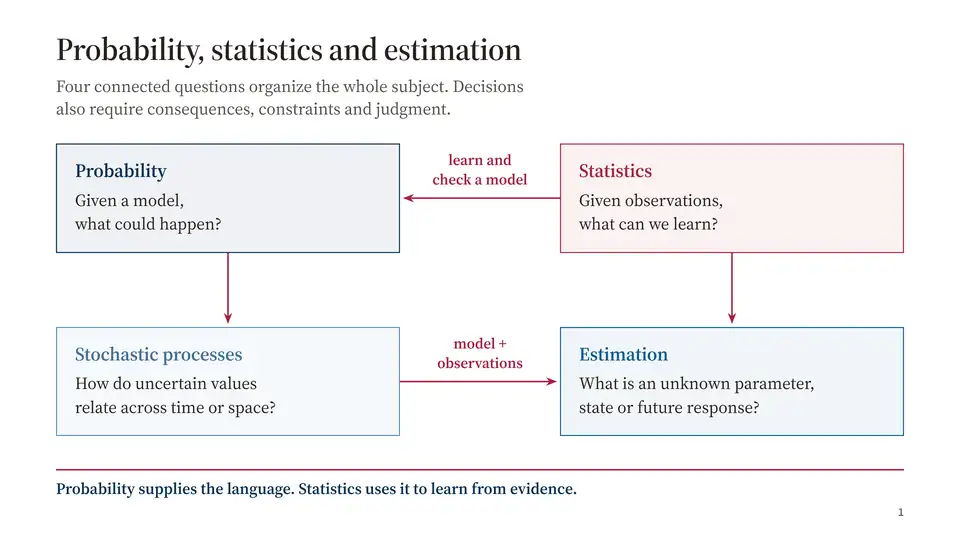
  1. Slide 1: Probability, statistics and estimation
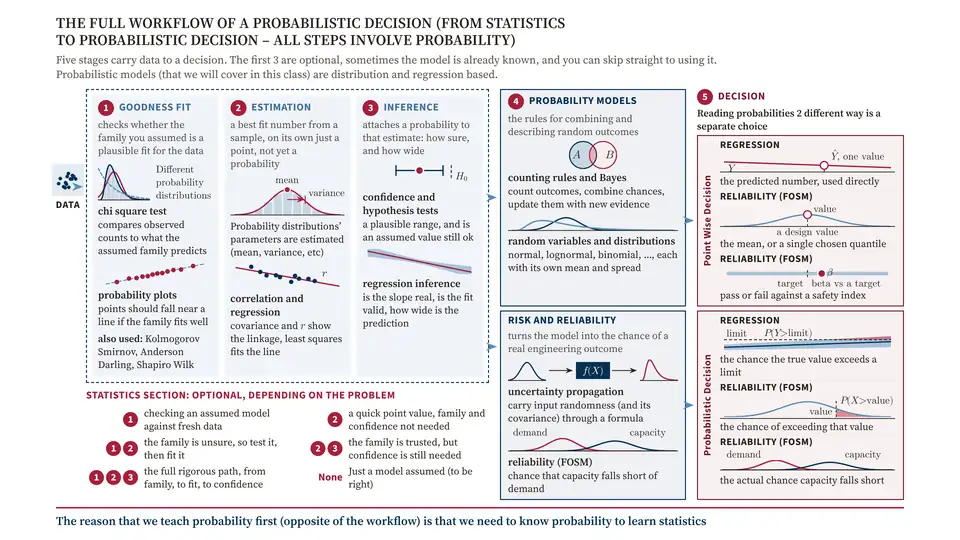
  2. Slide 2: THE FULL WORKFLOW OF A PROBABILISTIC DECISION (FROM STATISTICS TO PROBABILISTIC DECISION – ALL STEPS INVOLVE PROBABILITY)
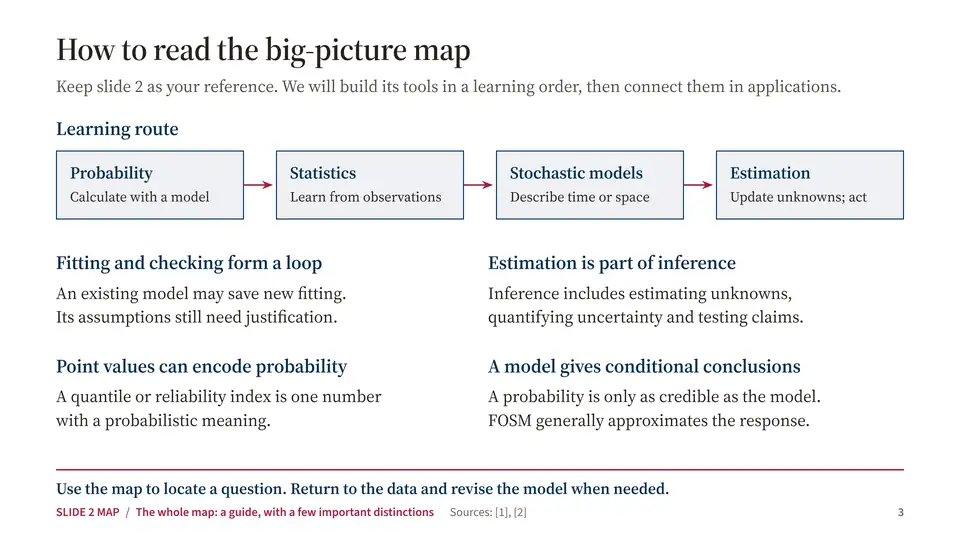
  3. Slide 3: How to read the big-picture map
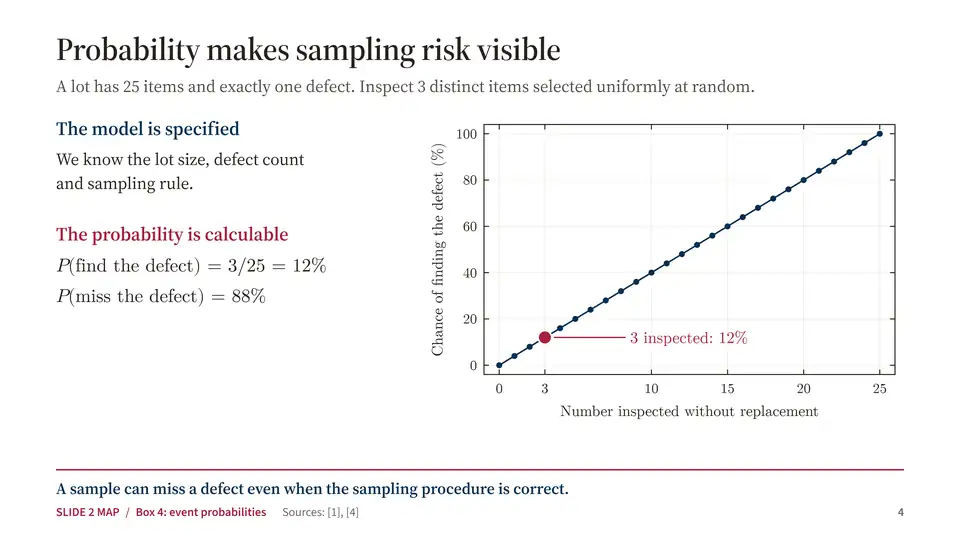
  4. Slide 4: Probability makes sampling risk visible
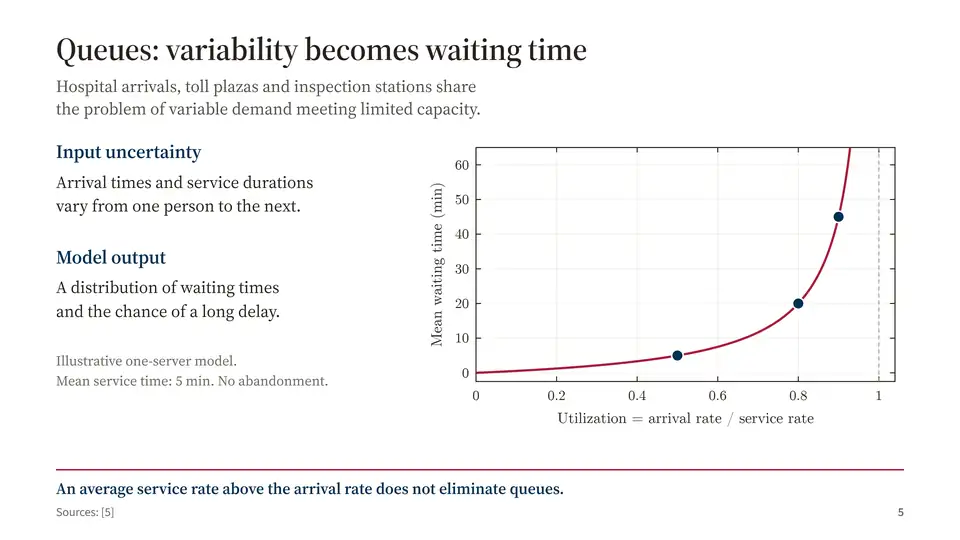
  5. Slide 5: Queues: variability becomes waiting time
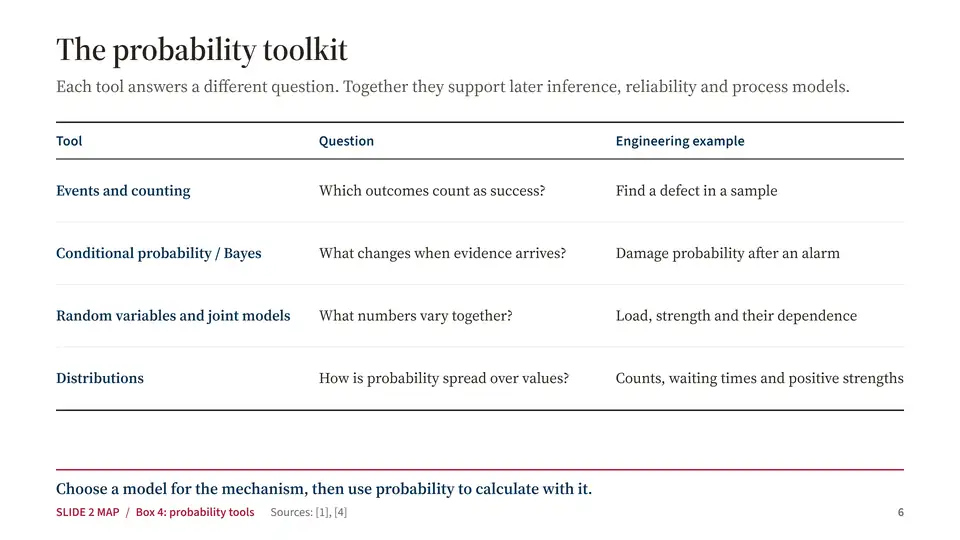
  6. Slide 6: The probability toolkit
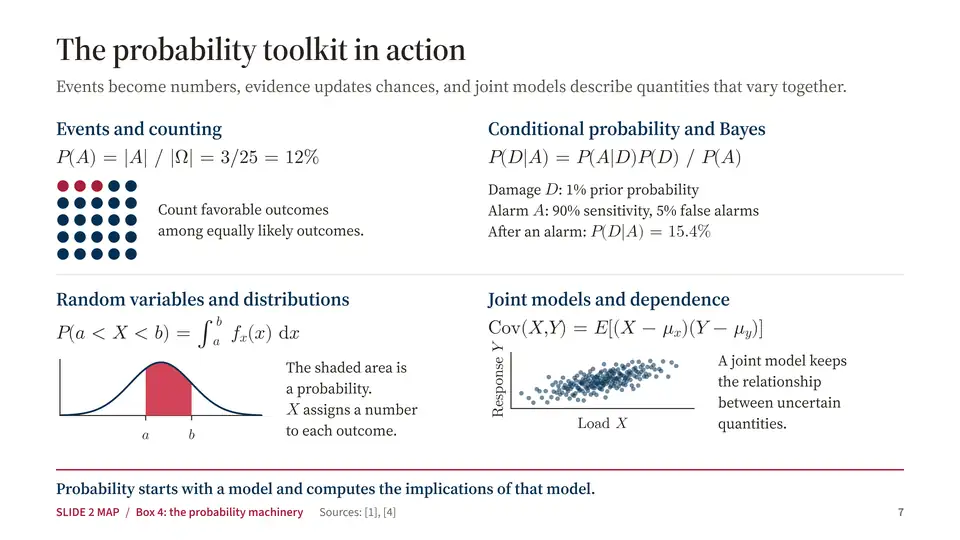
  7. Slide 7: The probability toolkit in action
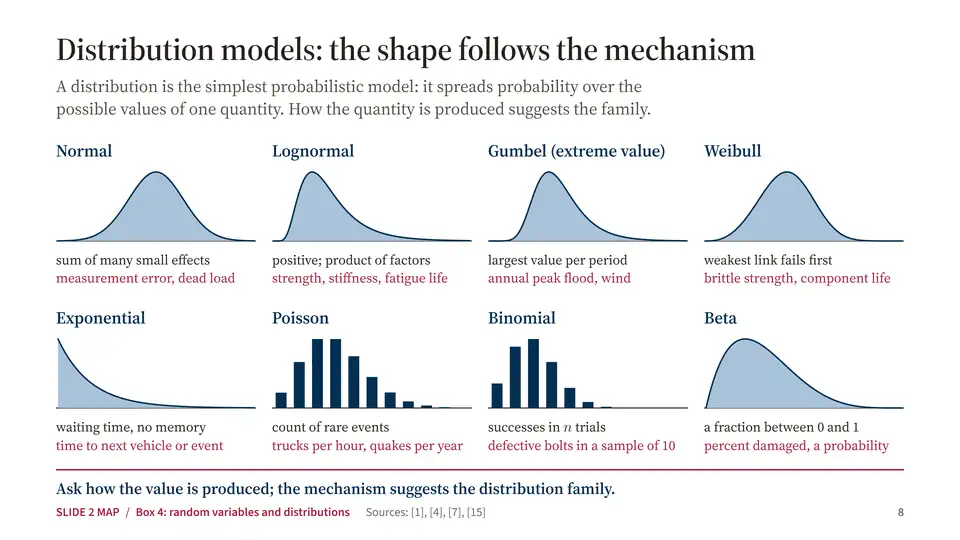
  8. Slide 8: Distribution models: the shape follows the mechanism
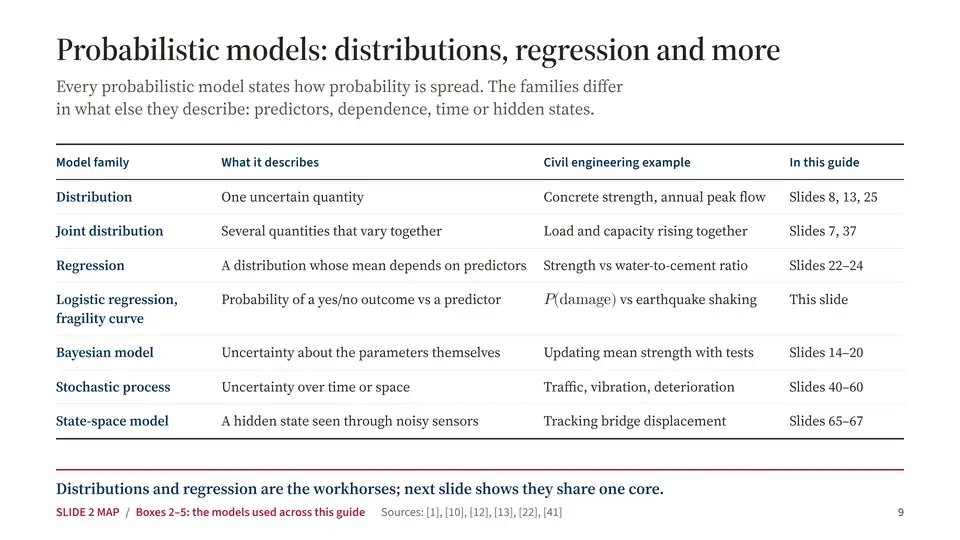
  9. Slide 9: Probabilistic models: distributions, regression and more
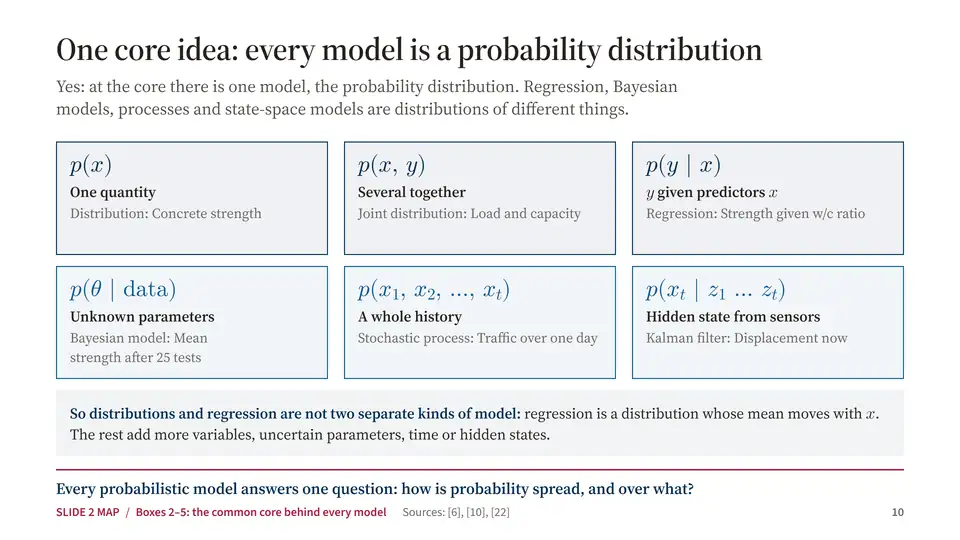
  10. Slide 10: One core idea: every model is a probability distribution
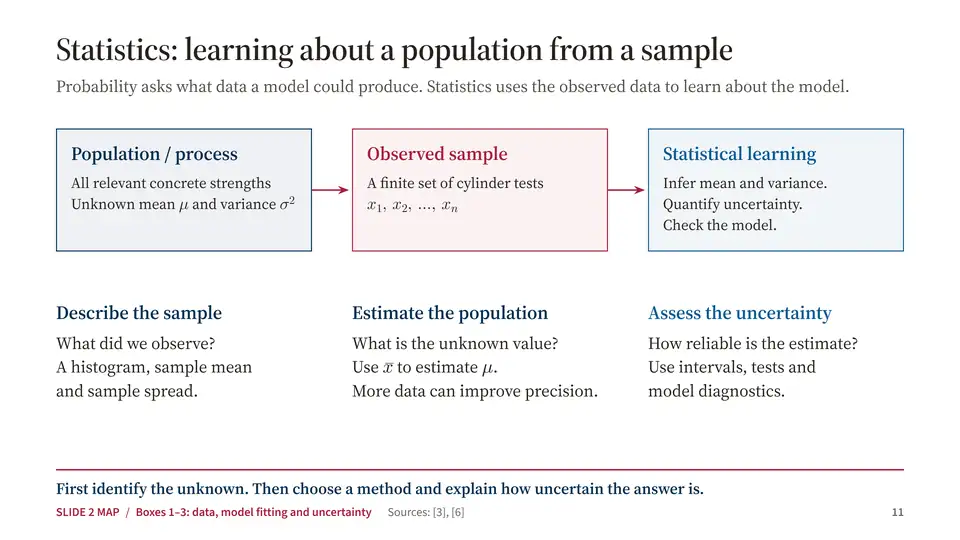
  11. Slide 11: Statistics: learning about a population from a sample
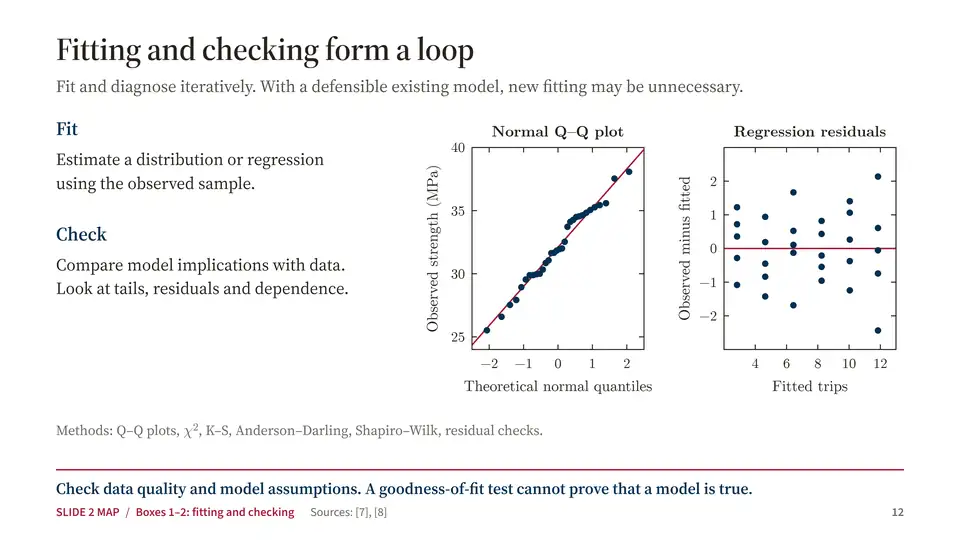
  12. Slide 12: Fitting and checking form a loop
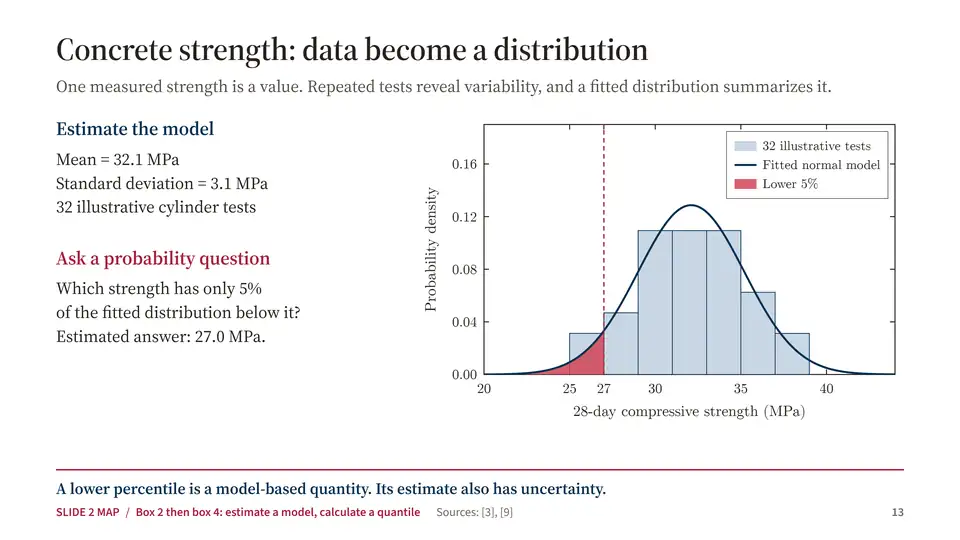
  13. Slide 13: Concrete strength: data become a distribution
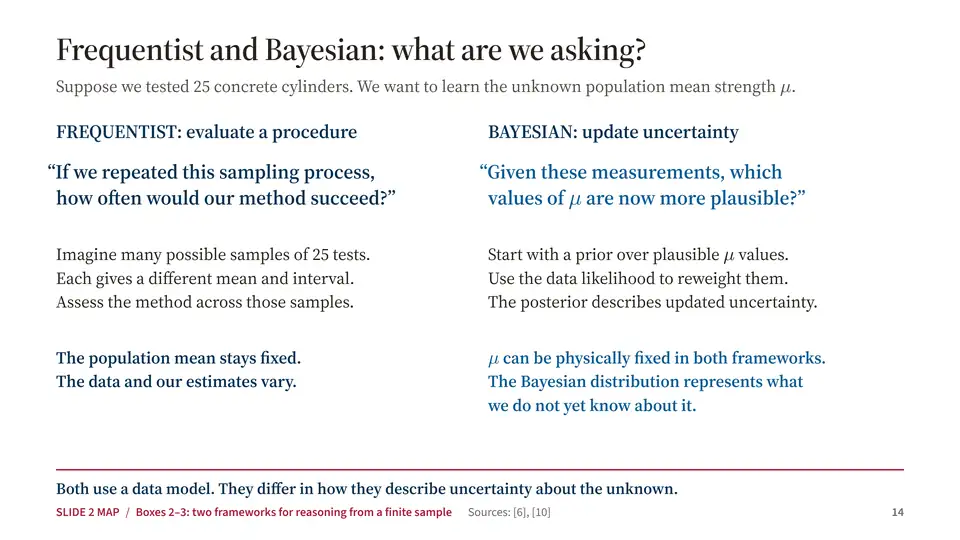
  14. Slide 14: Frequentist and Bayesian: what are we asking?
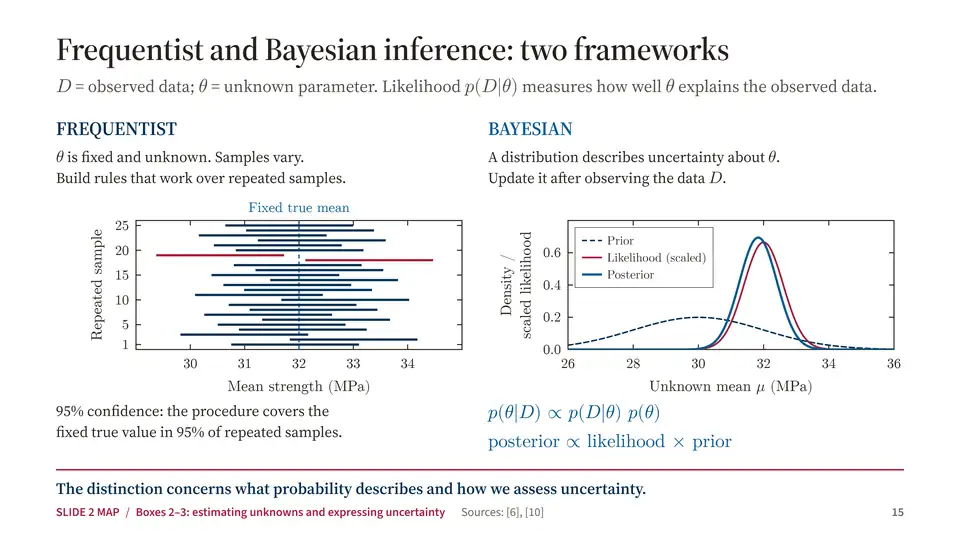
  15. Slide 15: Frequentist and Bayesian inference: two frameworks
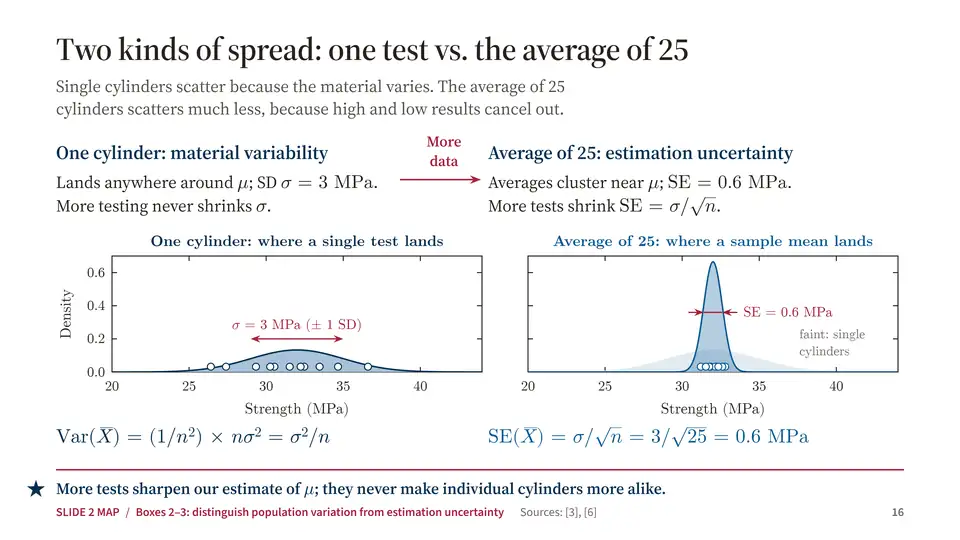
  16. Slide 16: Two kinds of spread: one test vs. the average of 25
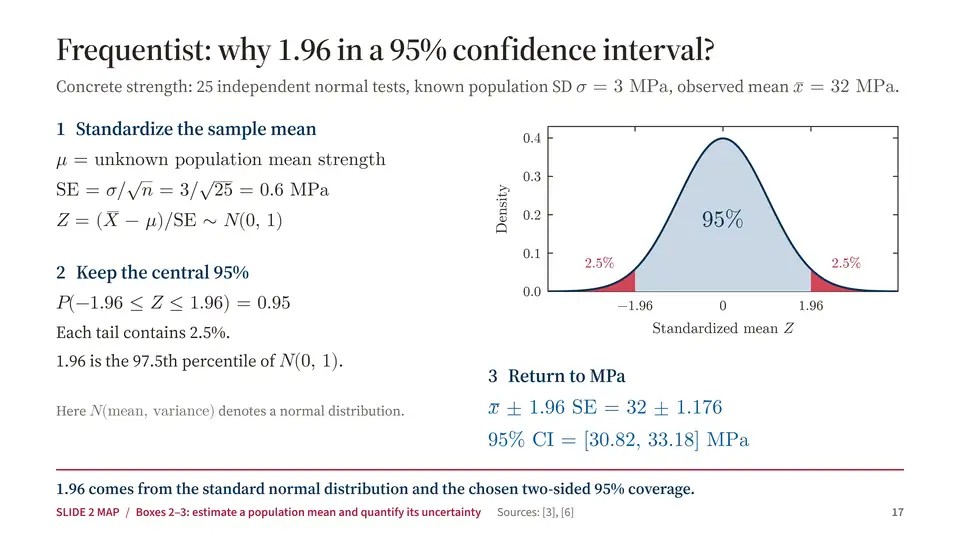
  17. Slide 17: Frequentist: why 1.96 in a 95% confidence interval?
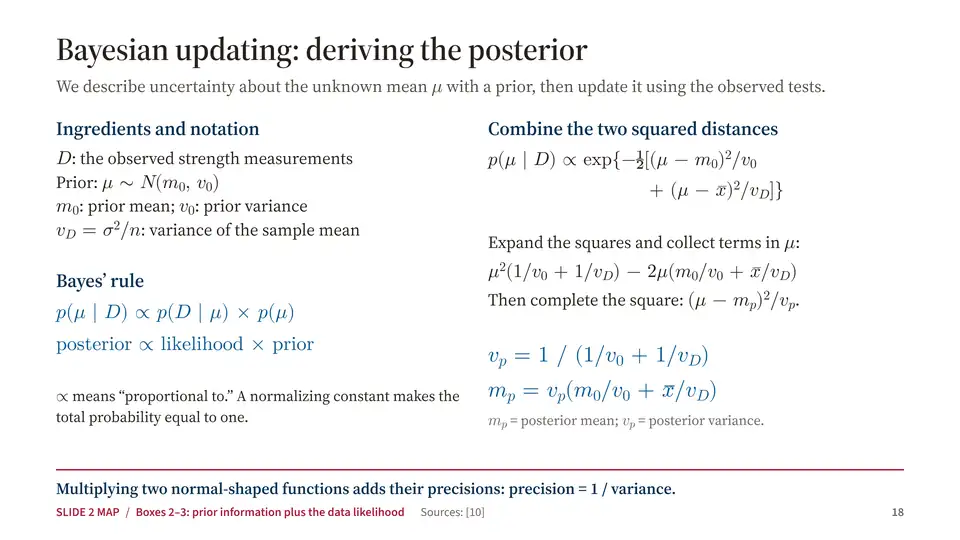
  18. Slide 18: Bayesian updating: deriving the posterior
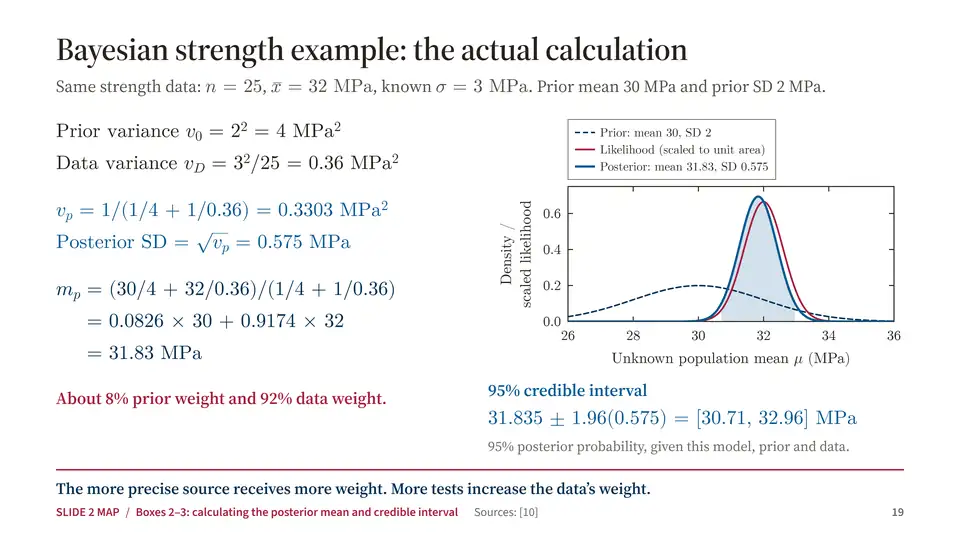
  19. Slide 19: Bayesian strength example: the actual calculation
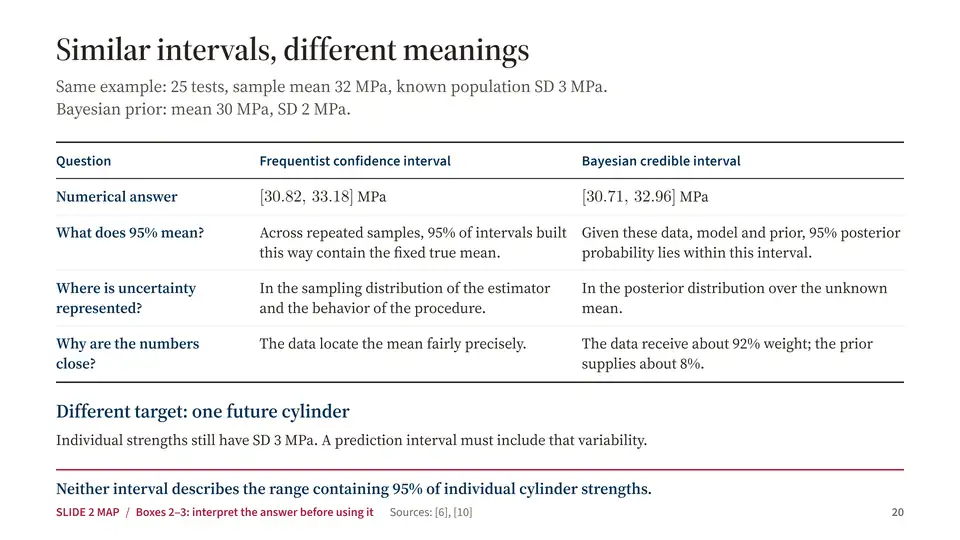
  20. Slide 20: Similar intervals, different meanings
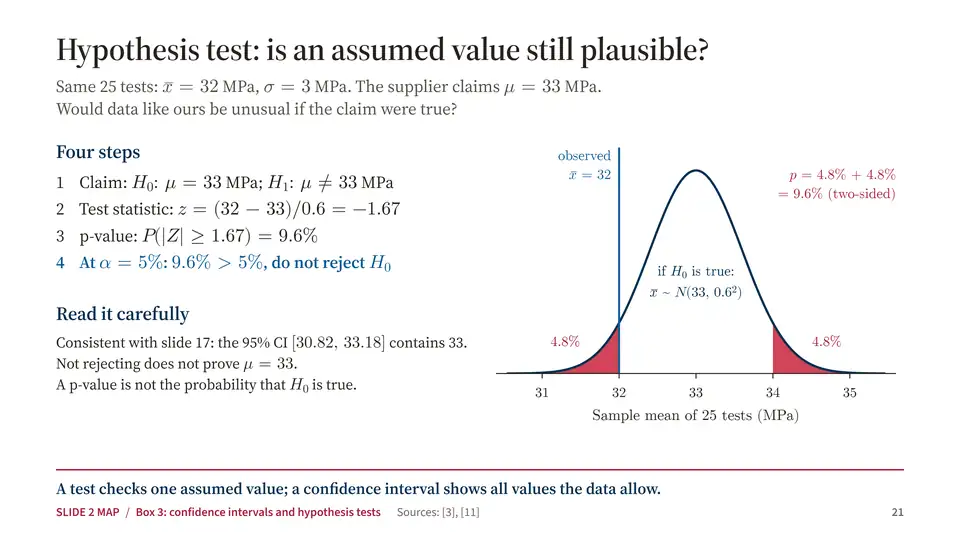
  21. Slide 21: Hypothesis test: is an assumed value still plausible?
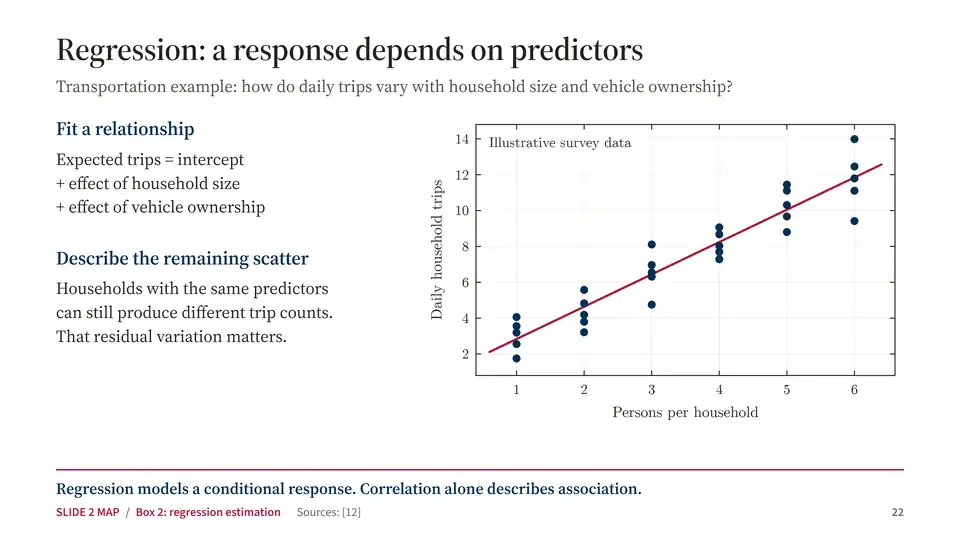
  22. Slide 22: Regression: a response depends on predictors
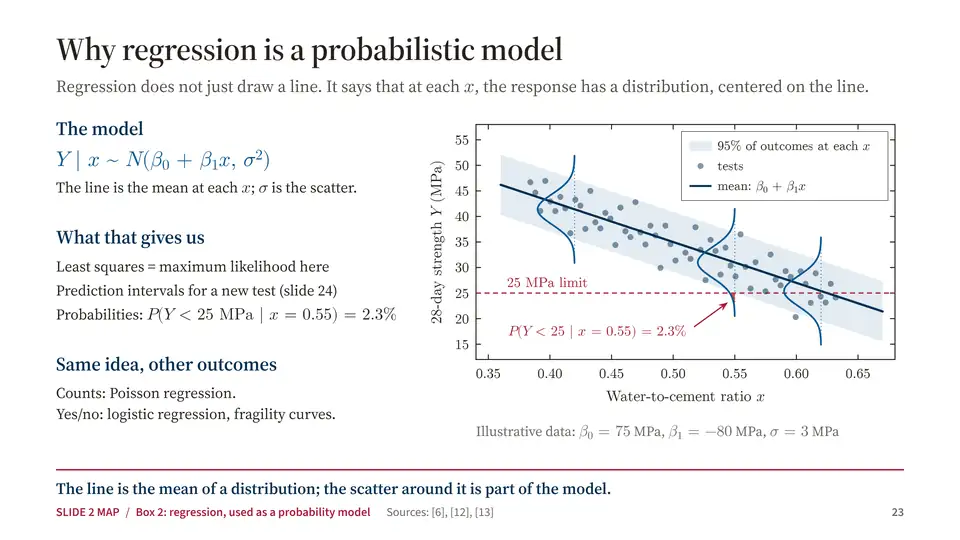
  23. Slide 23: Why regression is a probabilistic model
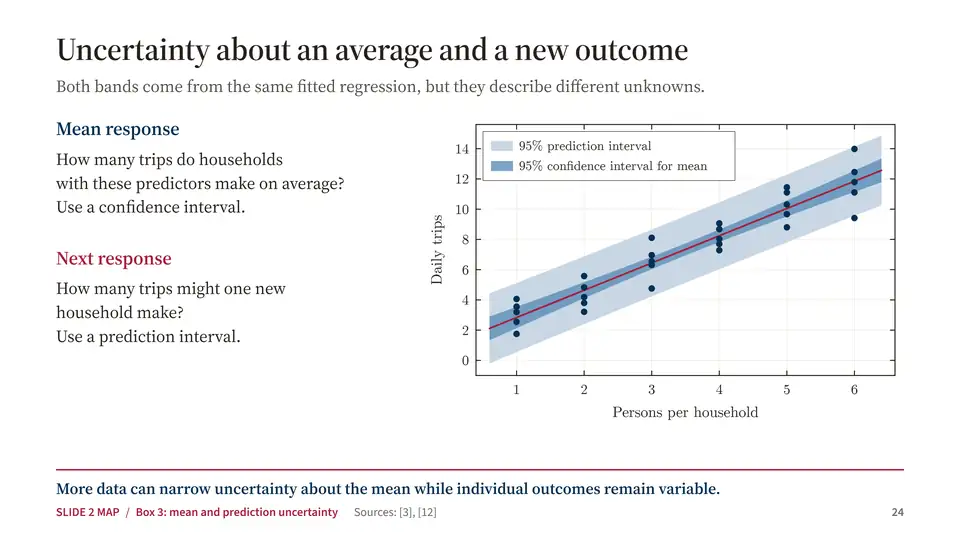
  24. Slide 24: Uncertainty about an average and a new outcome
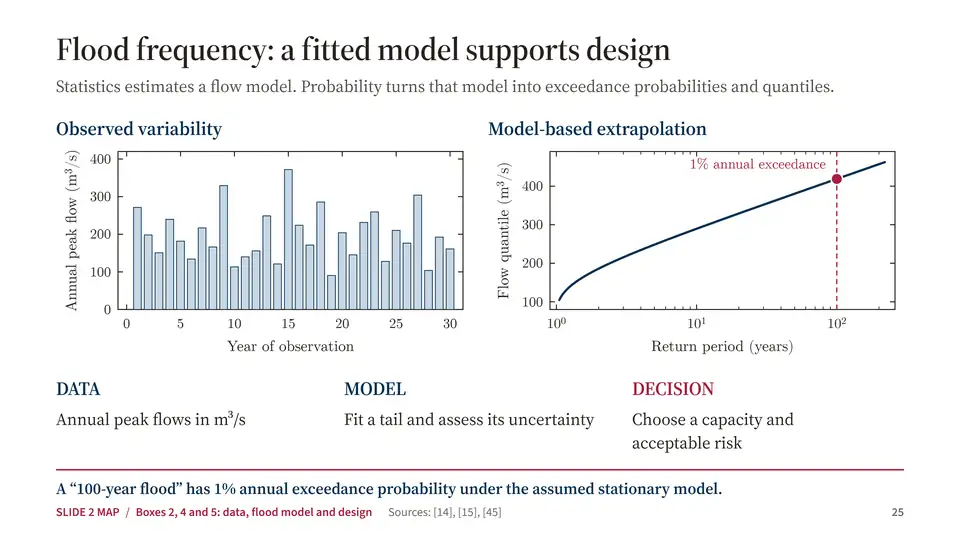
  25. Slide 25: Flood frequency: a fitted model supports design
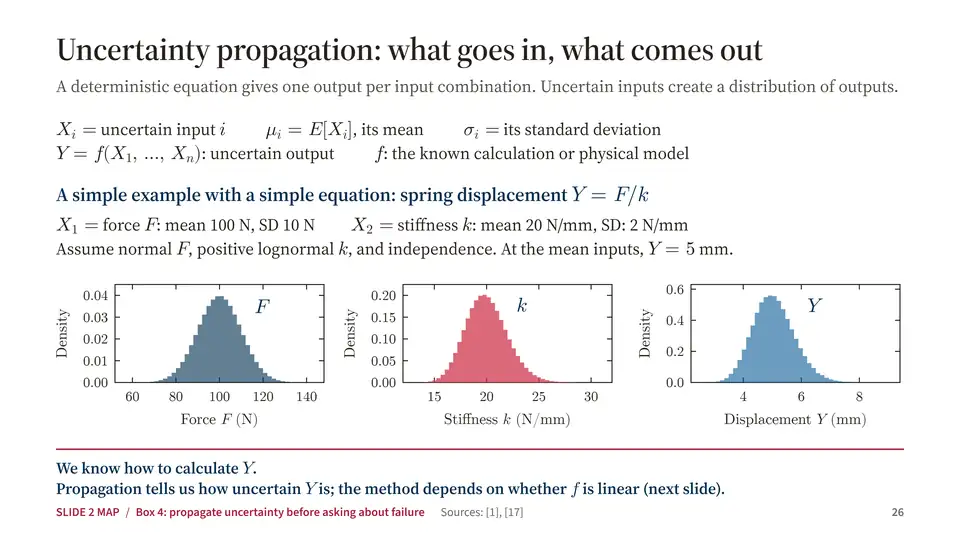
  26. Slide 26: Uncertainty propagation: what goes in, what comes out
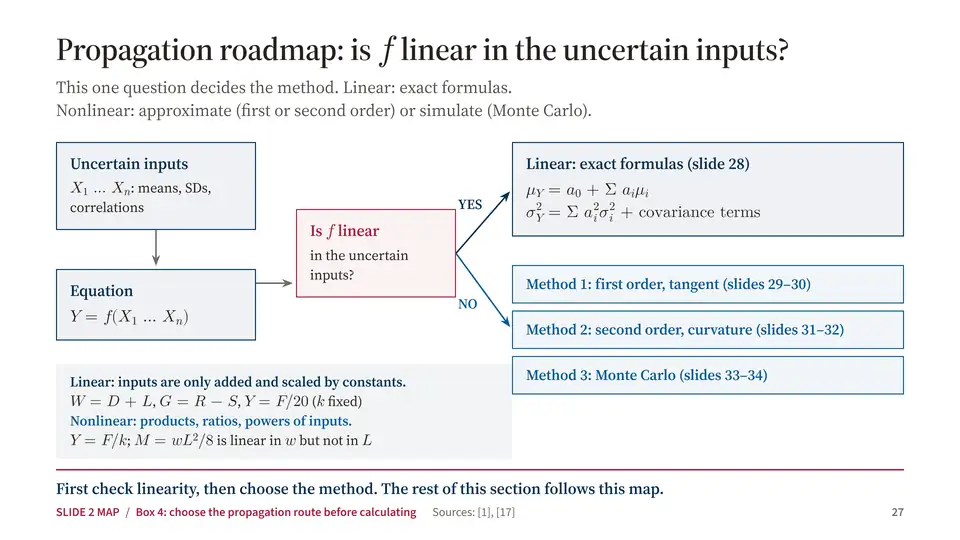
  27. Slide 27: Propagation roadmap: is f linear in the uncertain inputs?
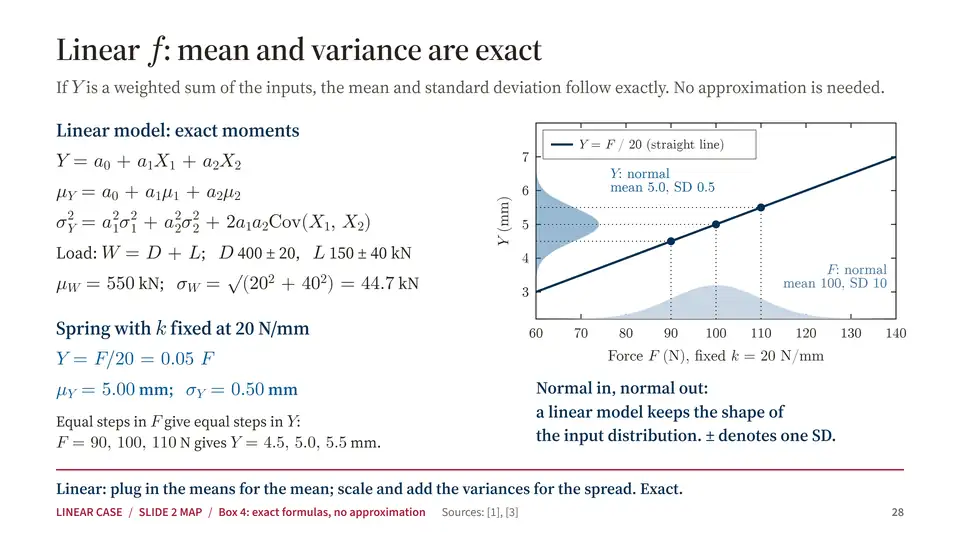
  28. Slide 28: Linear f: mean and variance are exact
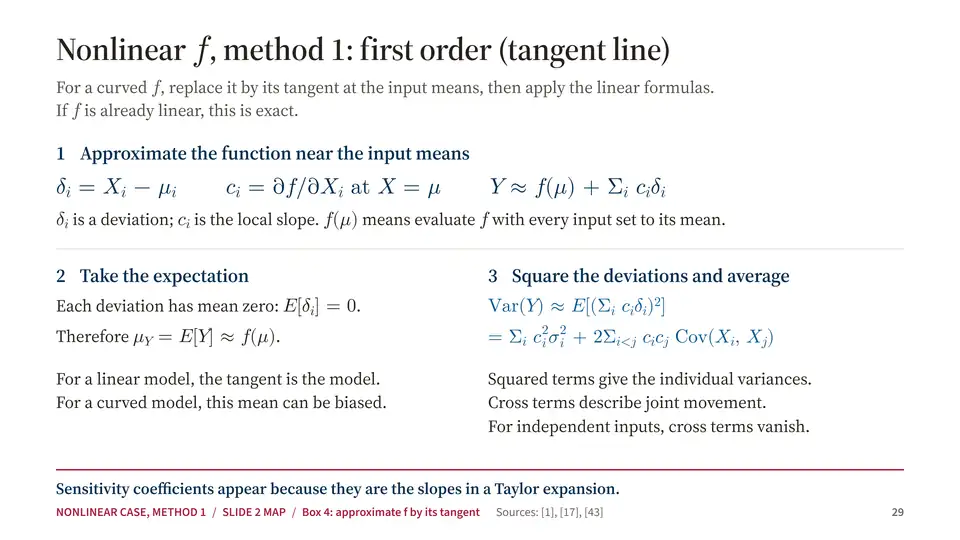
  29. Slide 29: Nonlinear f, method 1: first order (tangent line)
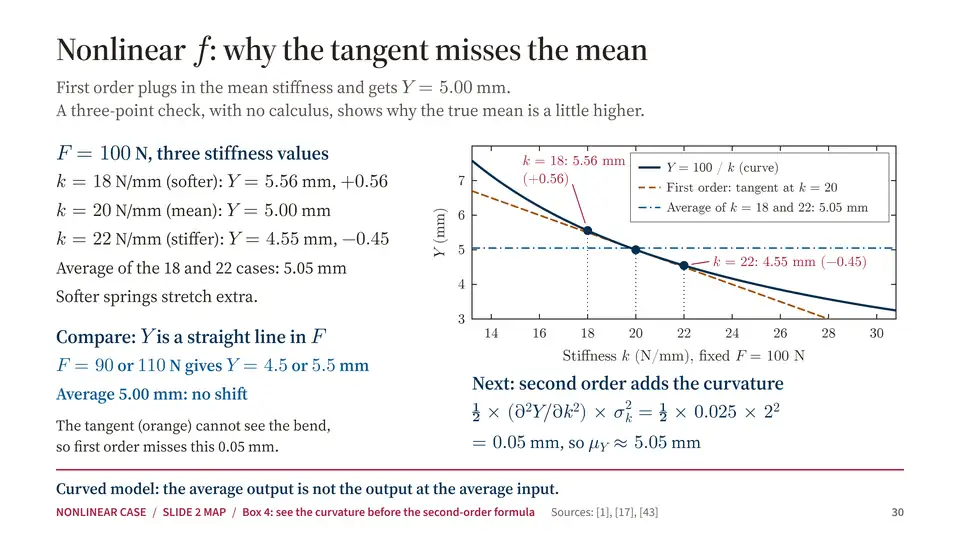
  30. Slide 30: Nonlinear f: why the tangent misses the mean
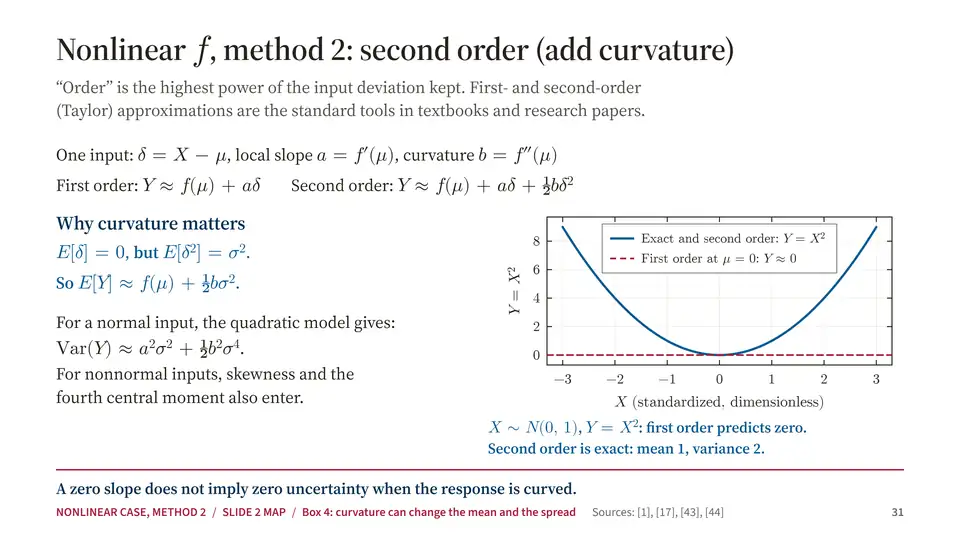
  31. Slide 31: Nonlinear f, method 2: second order (add curvature)
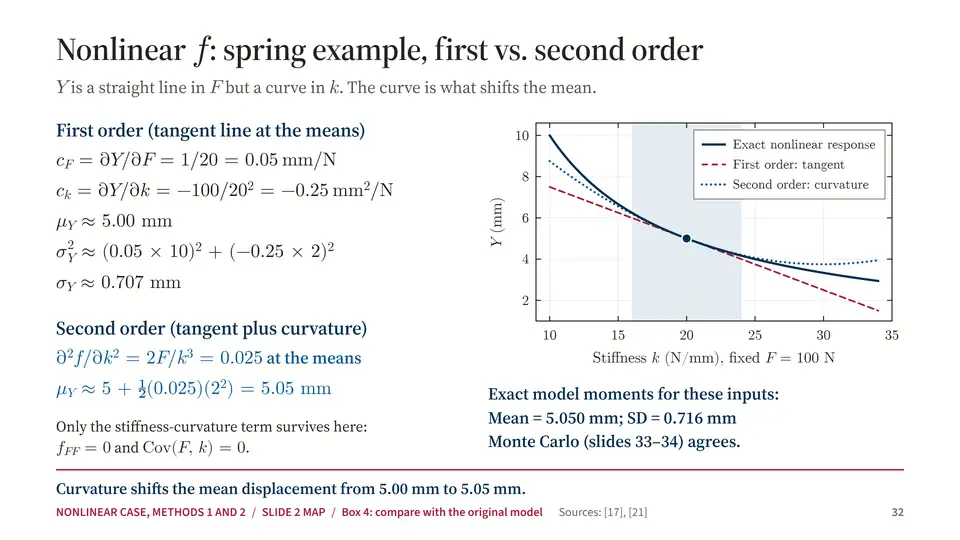
  32. Slide 32: Nonlinear f: spring example, first vs. second order
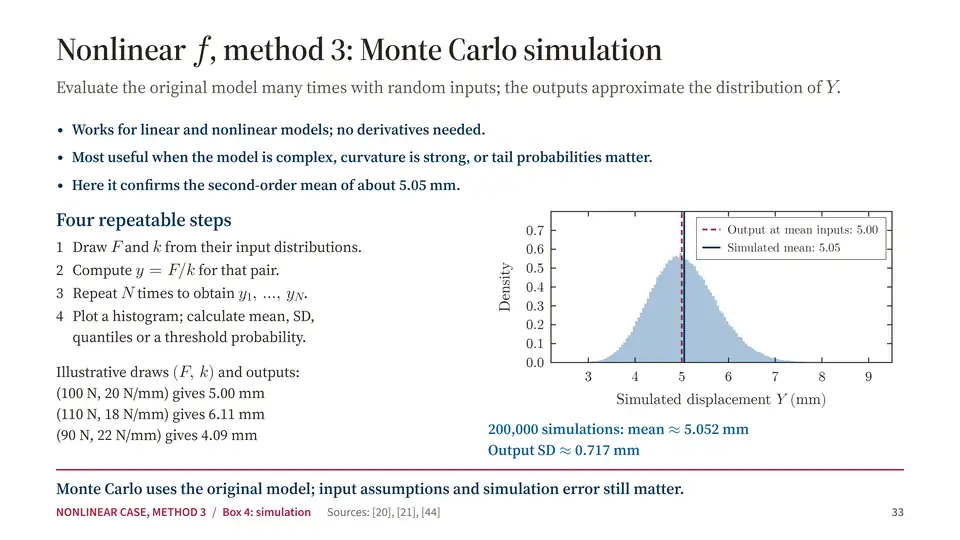
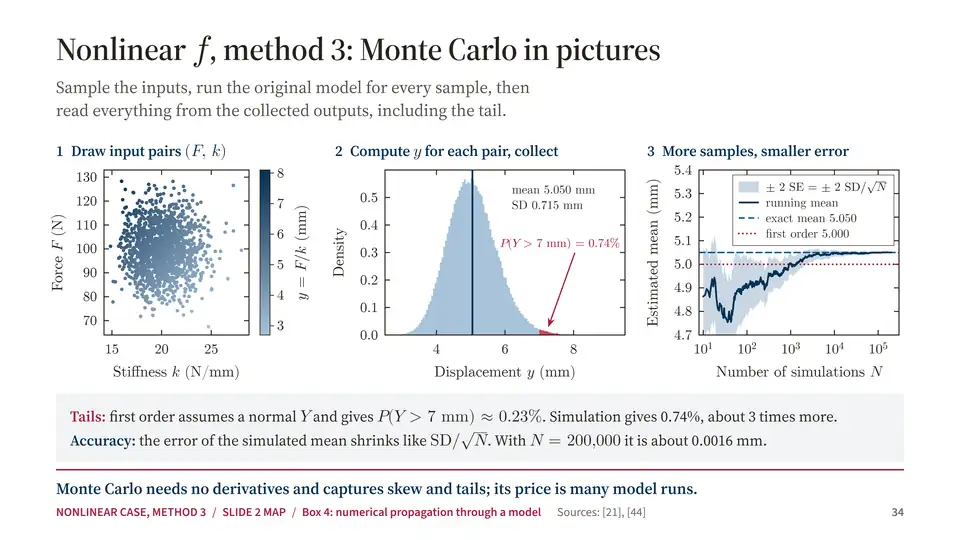
  33. Slide 33: Nonlinear f, method 3: Monte Carlo simulation
  34. Slide 34: Nonlinear f, method 3: Monte Carlo in pictures
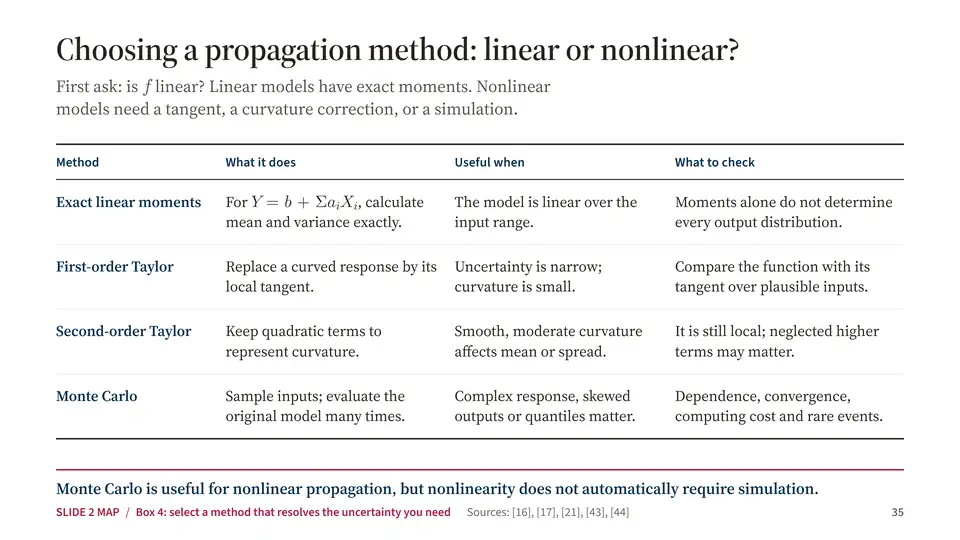
  35. Slide 35: Choosing a propagation method: linear or nonlinear?
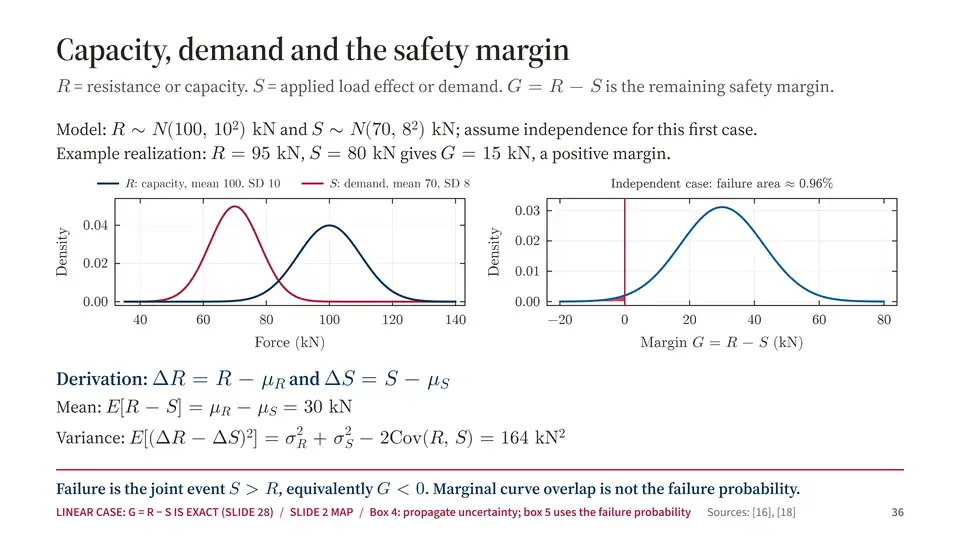
  36. Slide 36: Capacity, demand and the safety margin
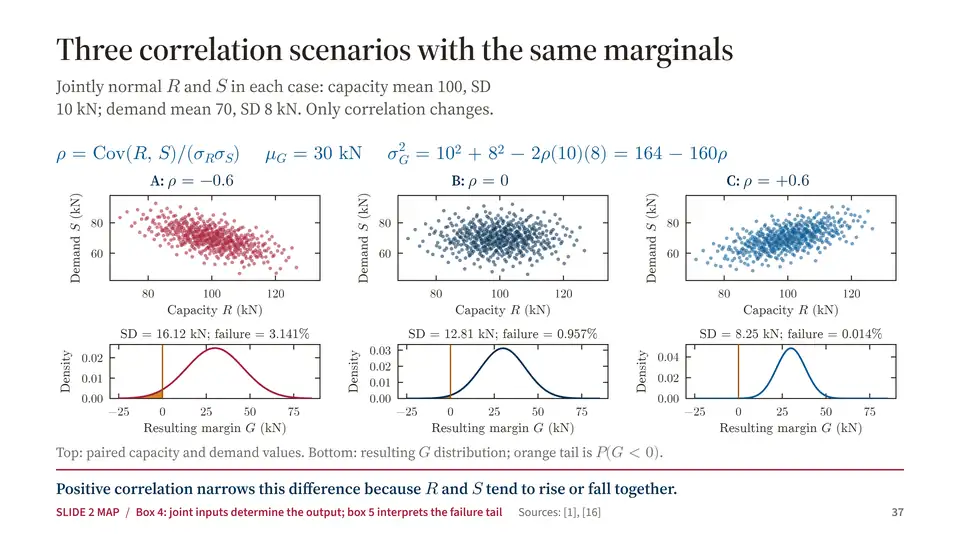
  37. Slide 37: Three correlation scenarios with the same marginals
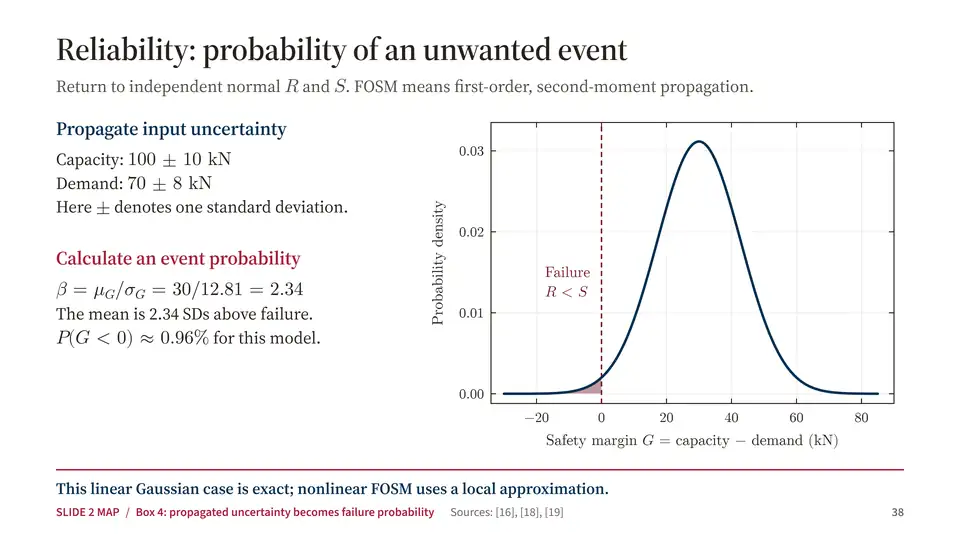
  38. Slide 38: Reliability: probability of an unwanted event
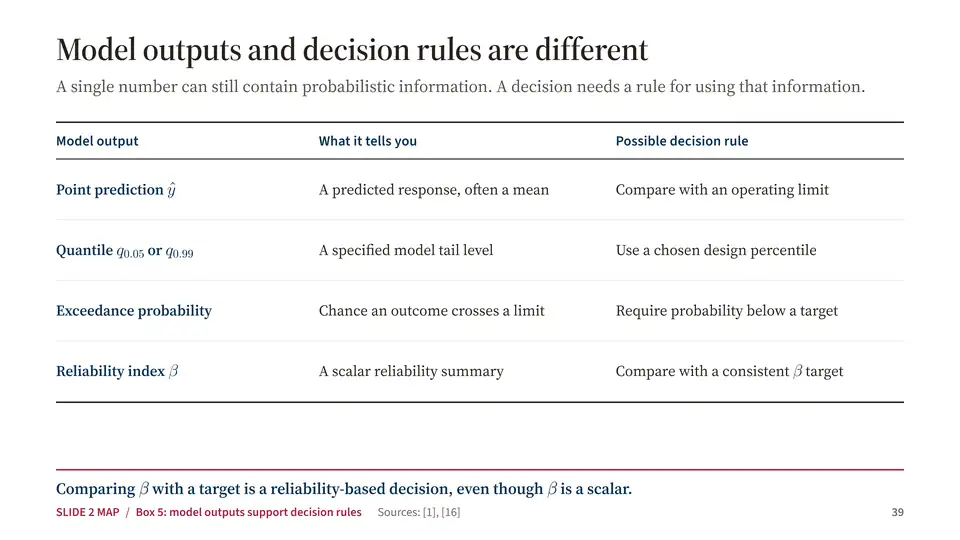
  39. Slide 39: Model outputs and decision rules are different
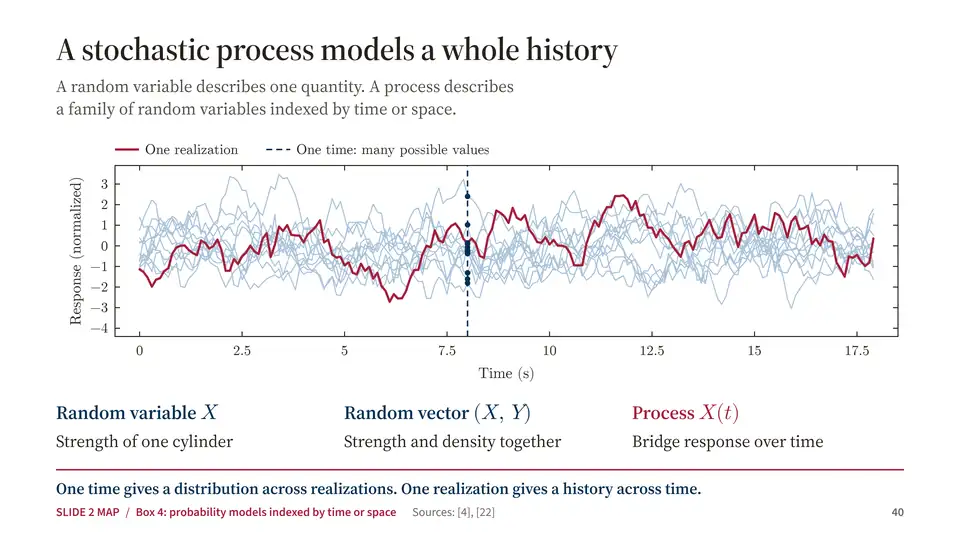
  40. Slide 40: A stochastic process models a whole history
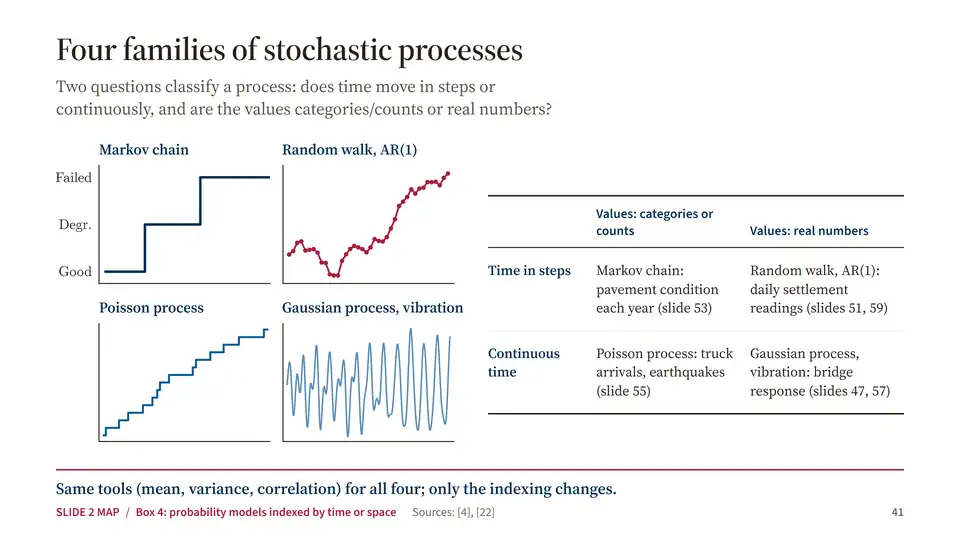
  41. Slide 41: Four families of stochastic processes
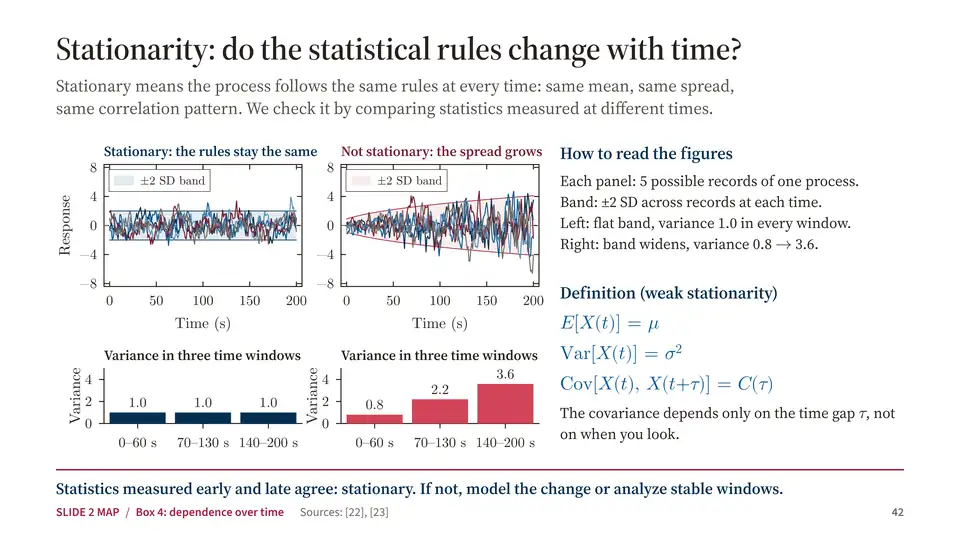
  42. Slide 42: Stationarity: do the statistical rules change with time?
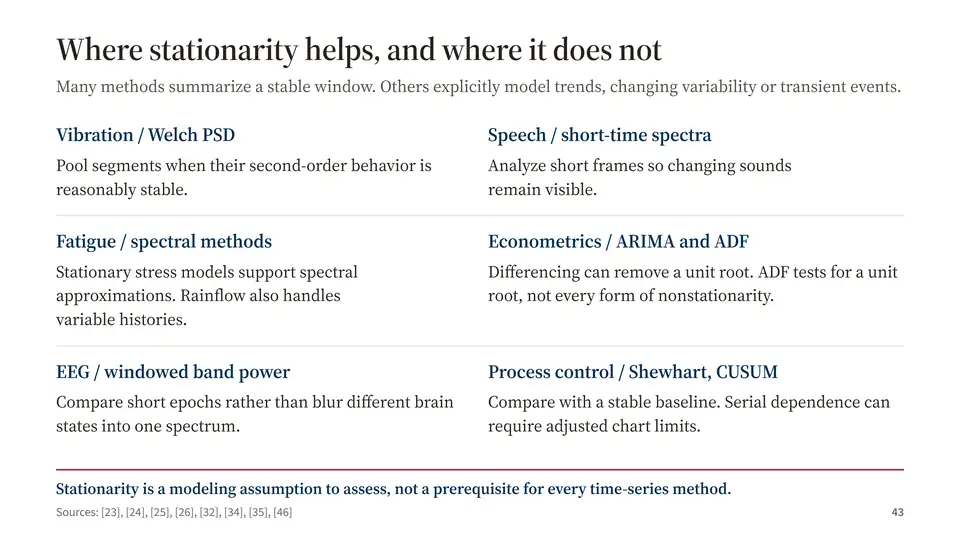
  43. Slide 43: Where stationarity helps, and where it does not
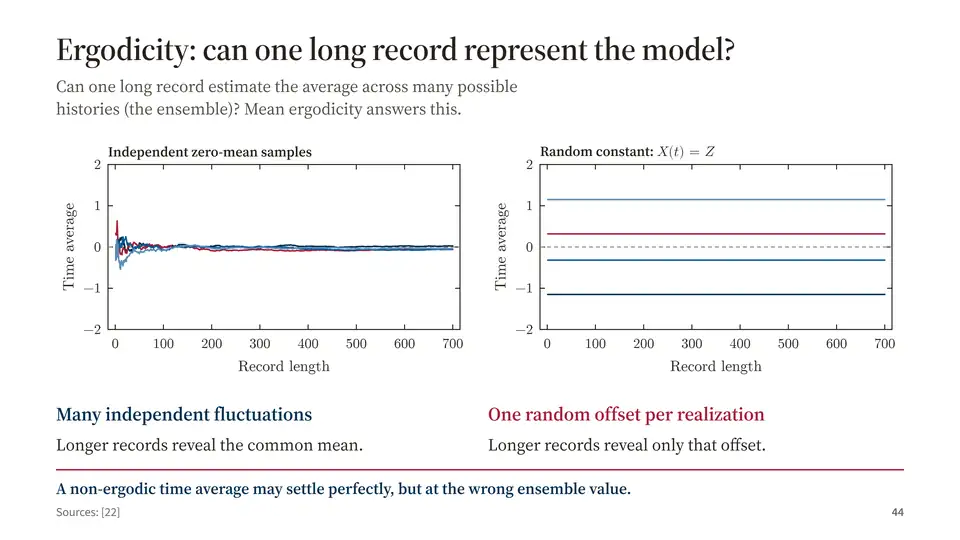
  44. Slide 44: Ergodicity: can one long record represent the model?
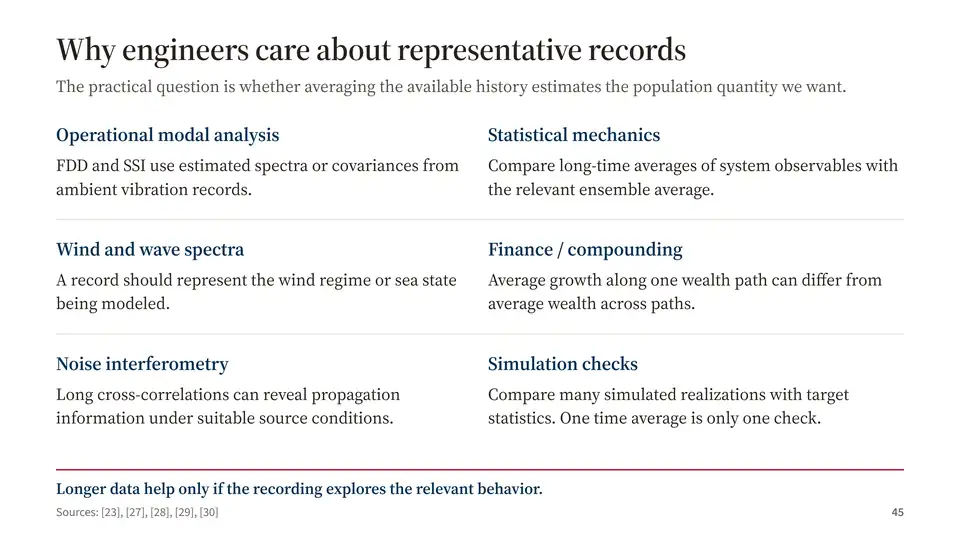
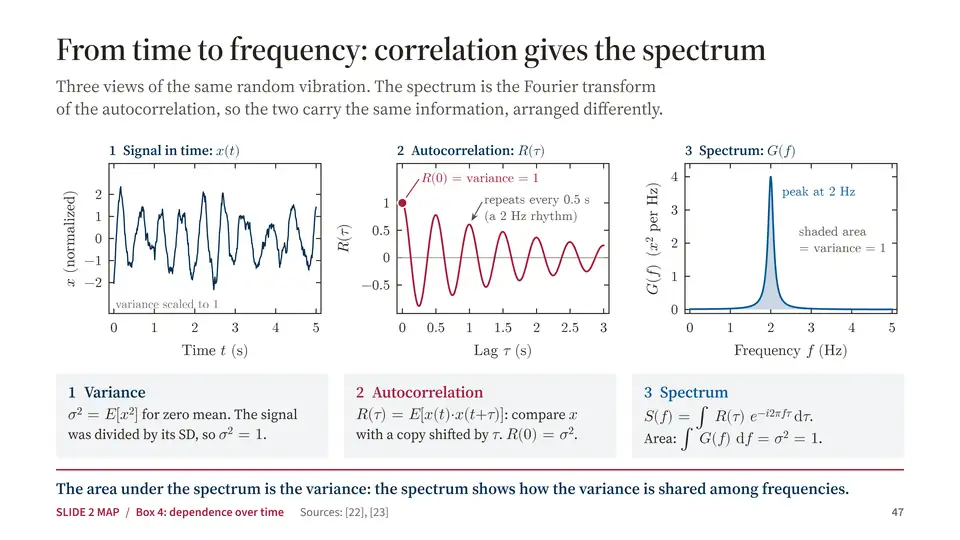
  45. Slide 45: Why engineers care about representative records
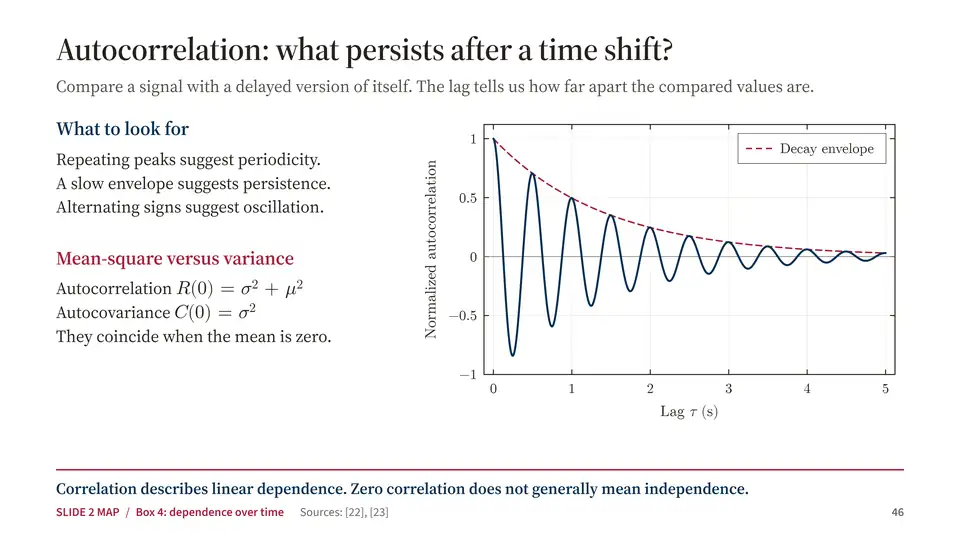
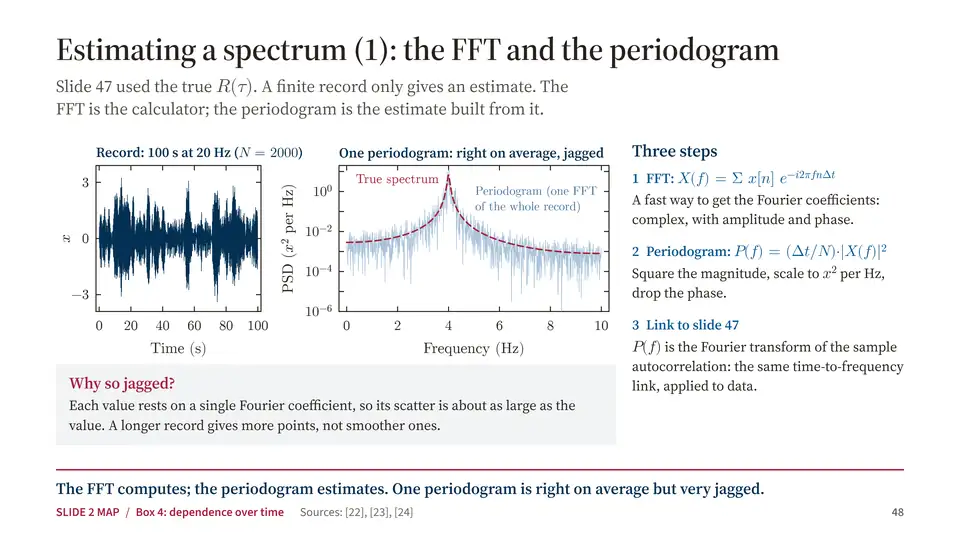
  46. Slide 46: Autocorrelation: what persists after a time shift?
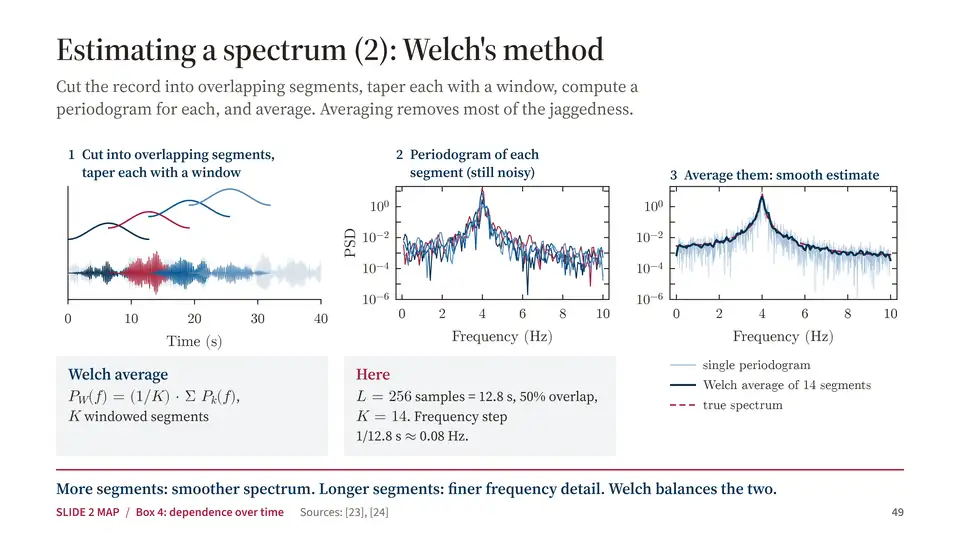
  47. Slide 47: From time to frequency: correlation gives the spectrum
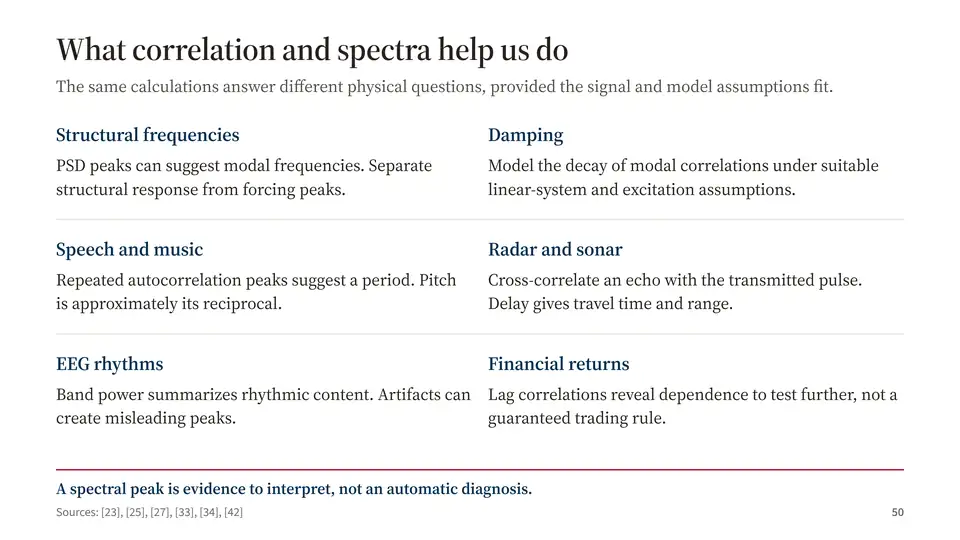
  48. Slide 48: Estimating a spectrum (1): the FFT and the periodogram
  49. Slide 49: Estimating a spectrum (2): Welch's method
  50. Slide 50: What correlation and spectra help us do
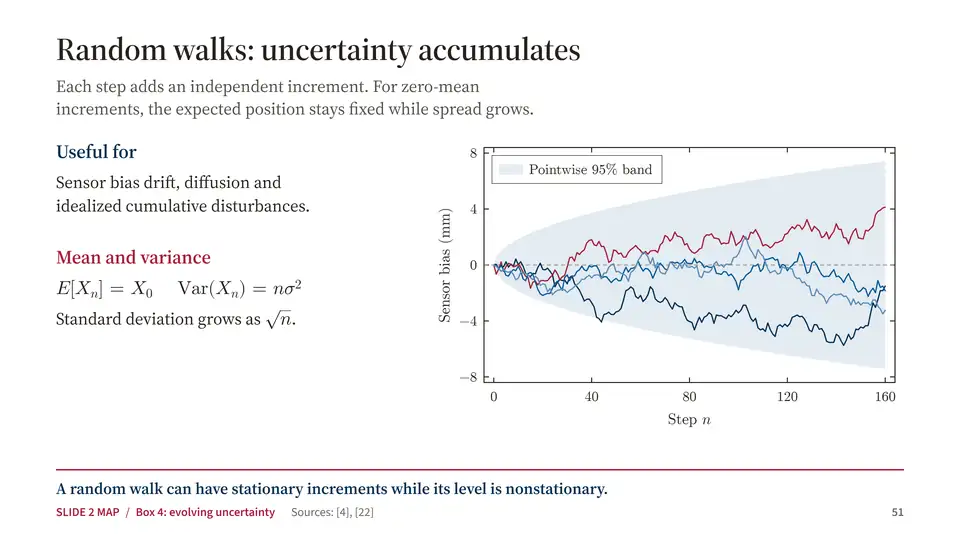
  51. Slide 51: Random walks: uncertainty accumulates
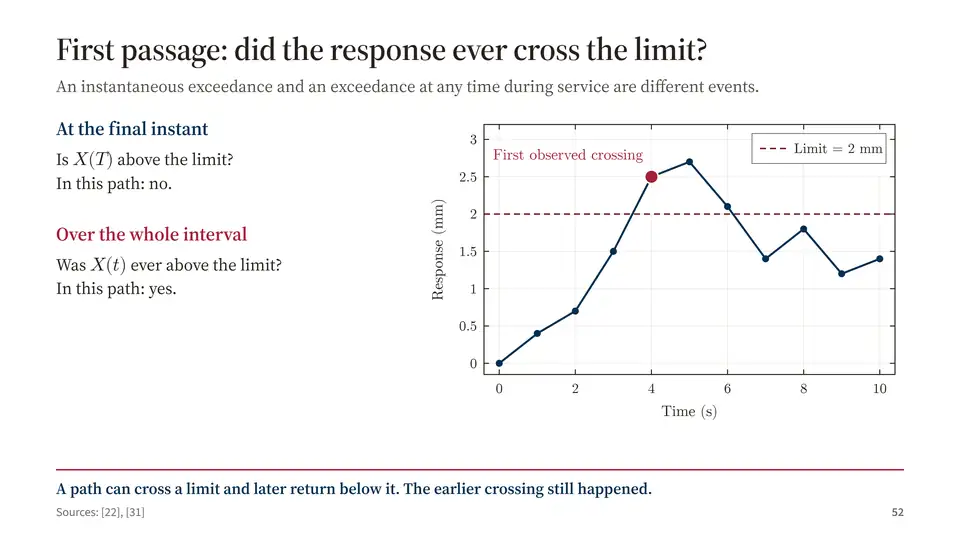
  52. Slide 52: First passage: did the response ever cross the limit?
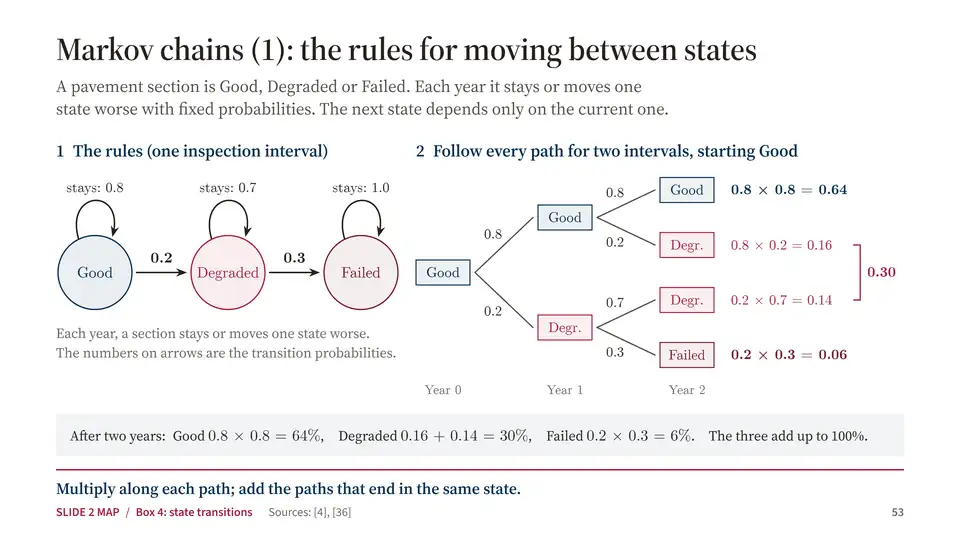
  53. Slide 53: Markov chains (1): the rules for moving between states
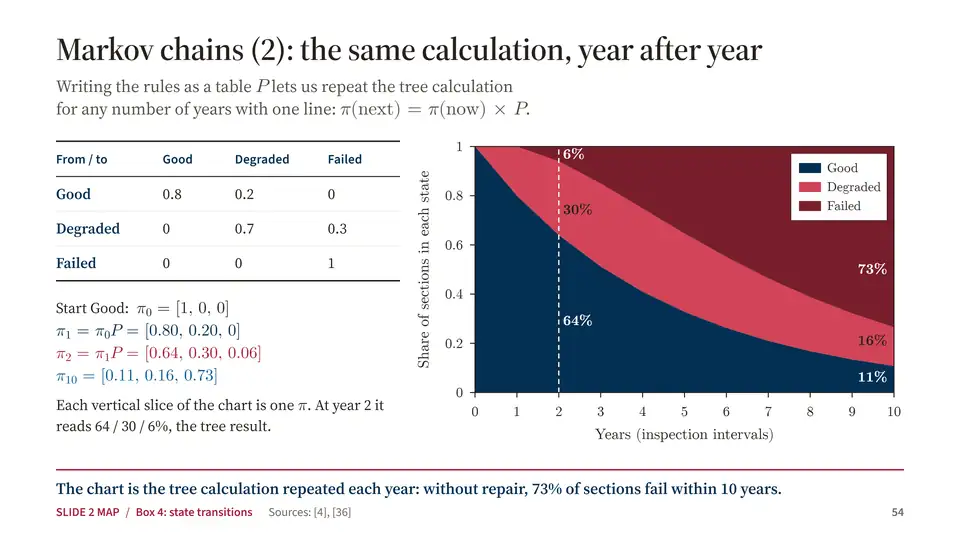
  54. Slide 54: Markov chains (2): the same calculation, year after year
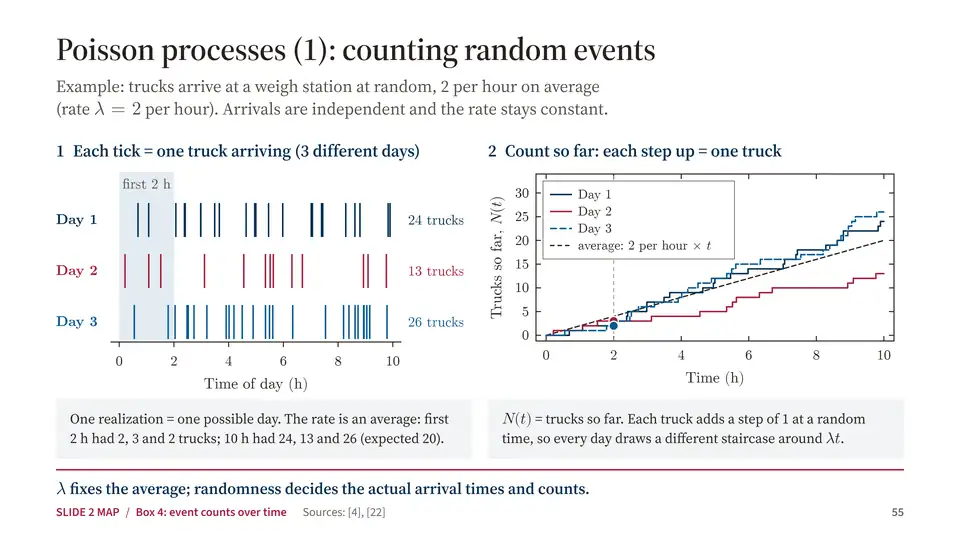
  55. Slide 55: Poisson processes (1): counting random events
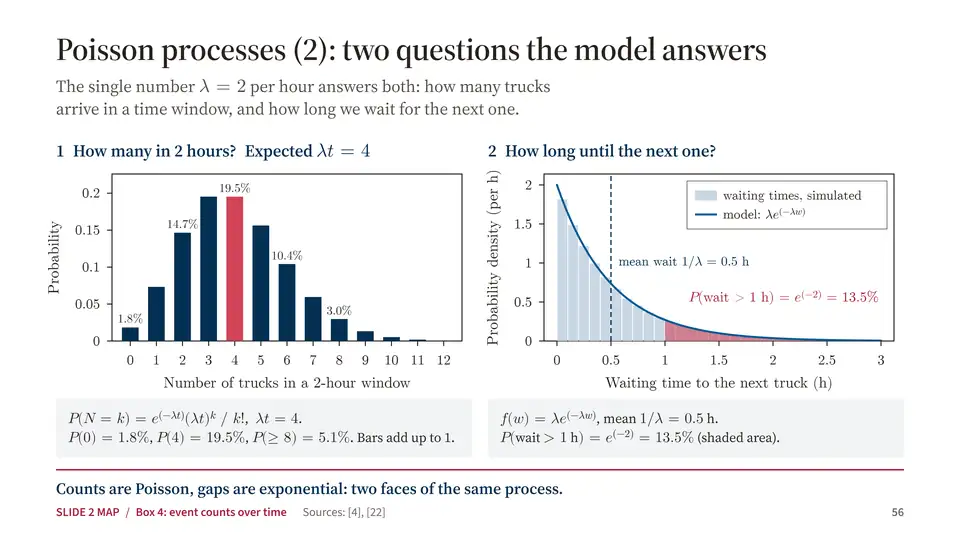
  56. Slide 56: Poisson processes (2): two questions the model answers
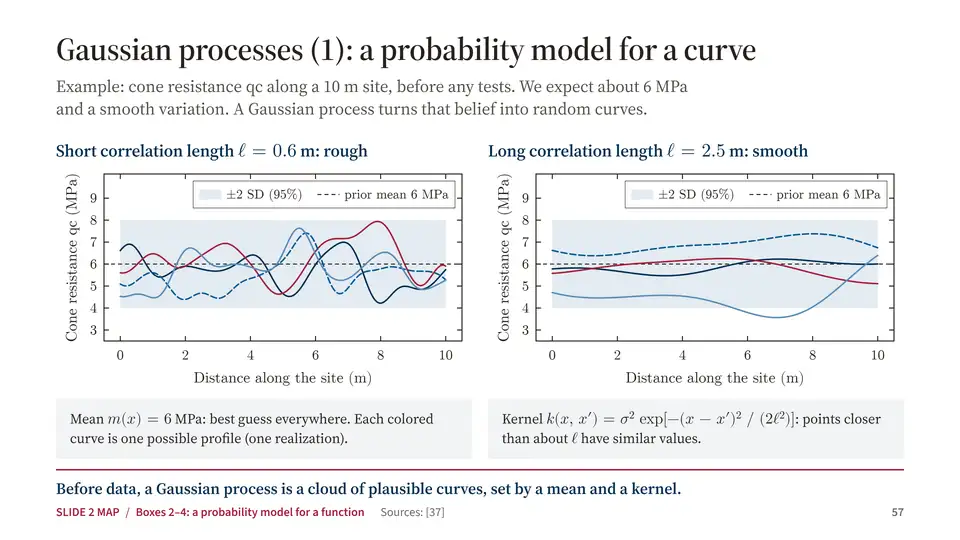
  57. Slide 57: Gaussian processes (1): a probability model for a curve
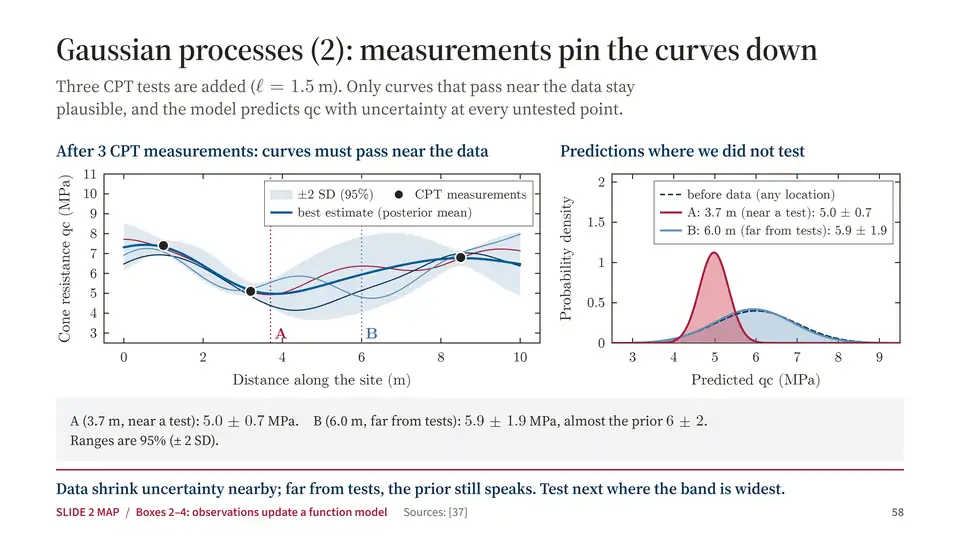
  58. Slide 58: Gaussian processes (2): measurements pin the curves down
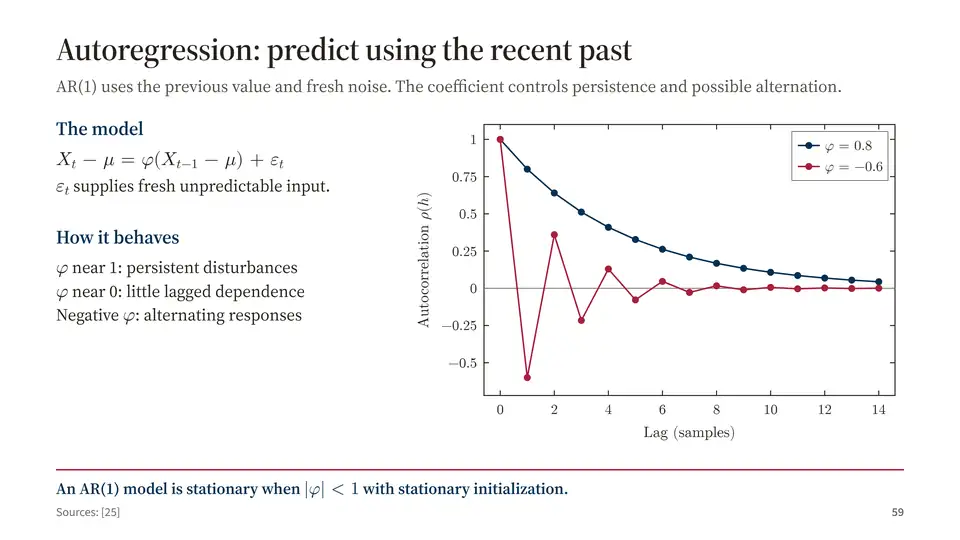
  59. Slide 59: Autoregression: predict using the recent past
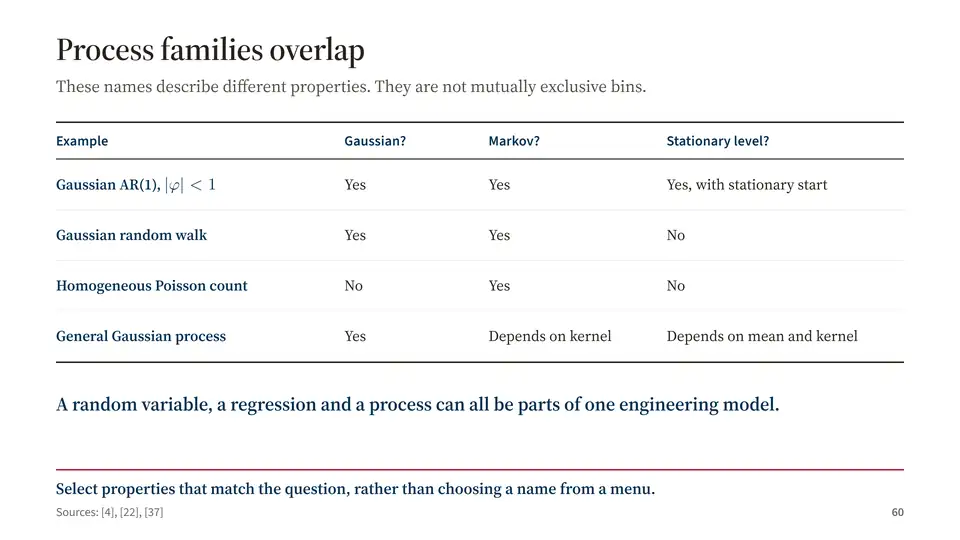
  60. Slide 60: Process families overlap
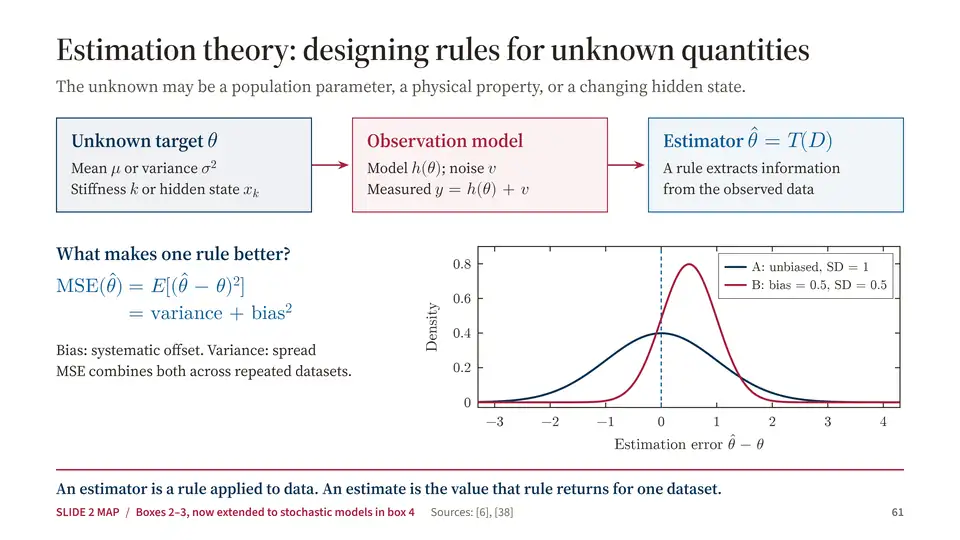
  61. Slide 61: Estimation theory: designing rules for unknown quantities
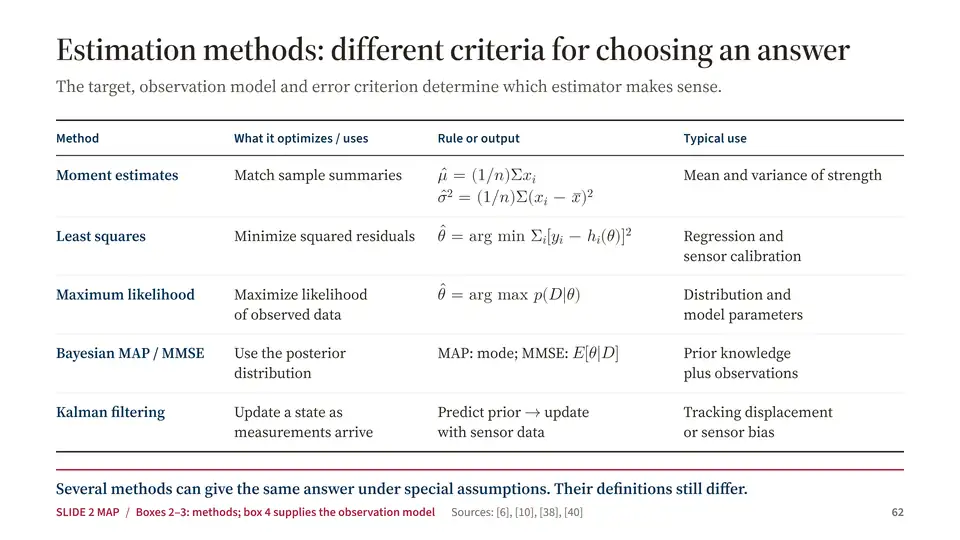
  62. Slide 62: Estimation methods: different criteria for choosing an answer
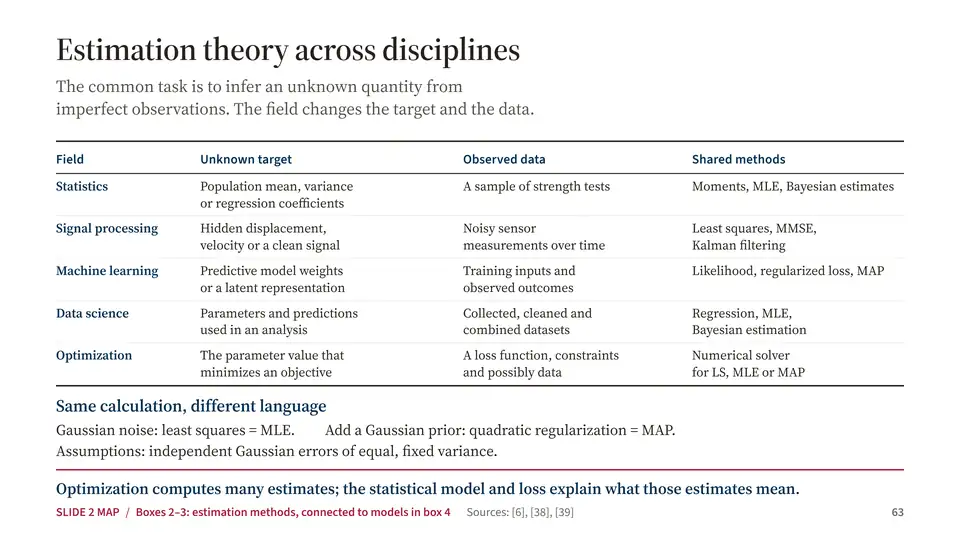
  63. Slide 63: Estimation theory across disciplines
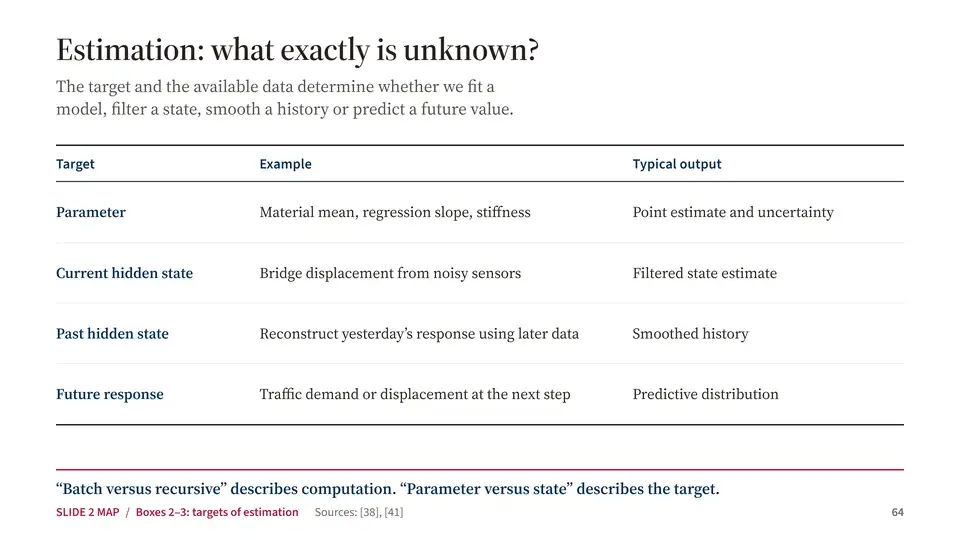
  64. Slide 64: Estimation: what exactly is unknown?
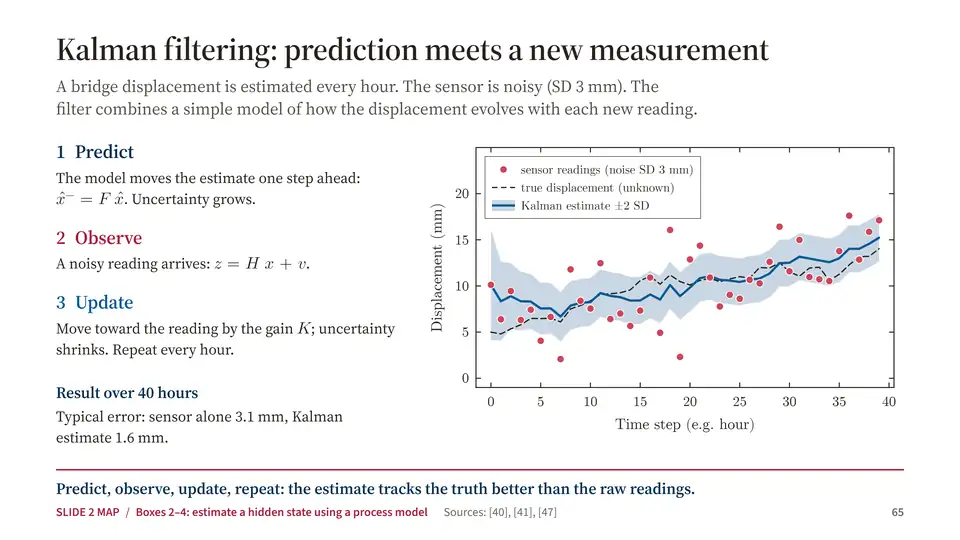
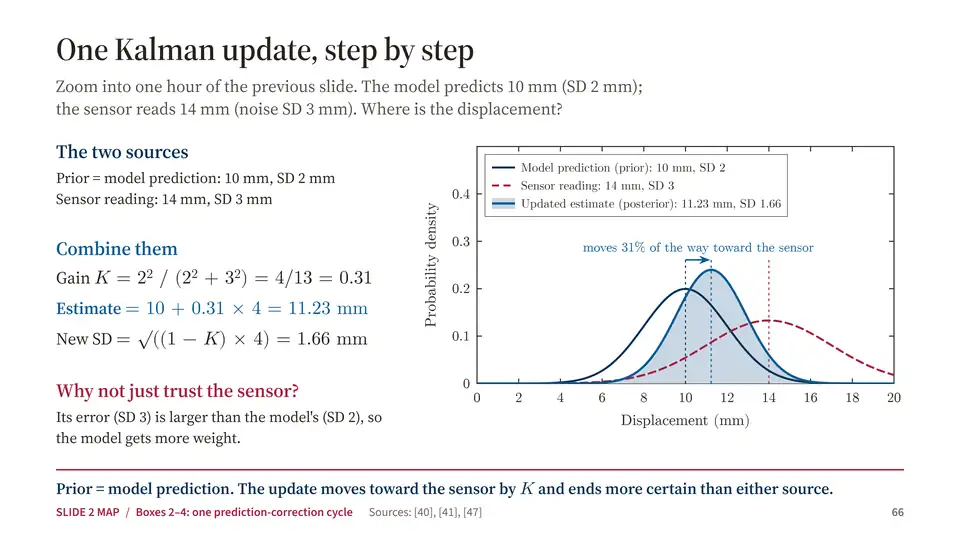
  65. Slide 65: Kalman filtering: prediction meets a new measurement
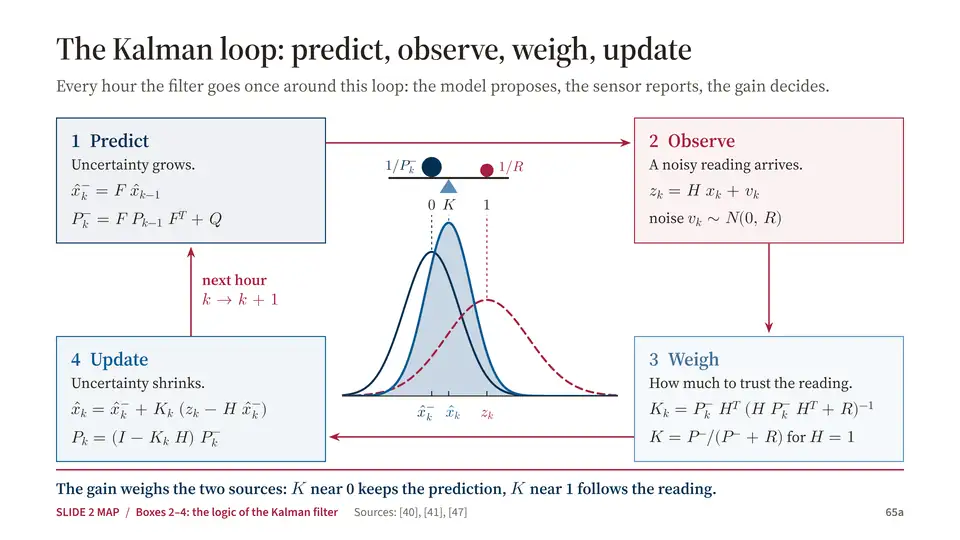
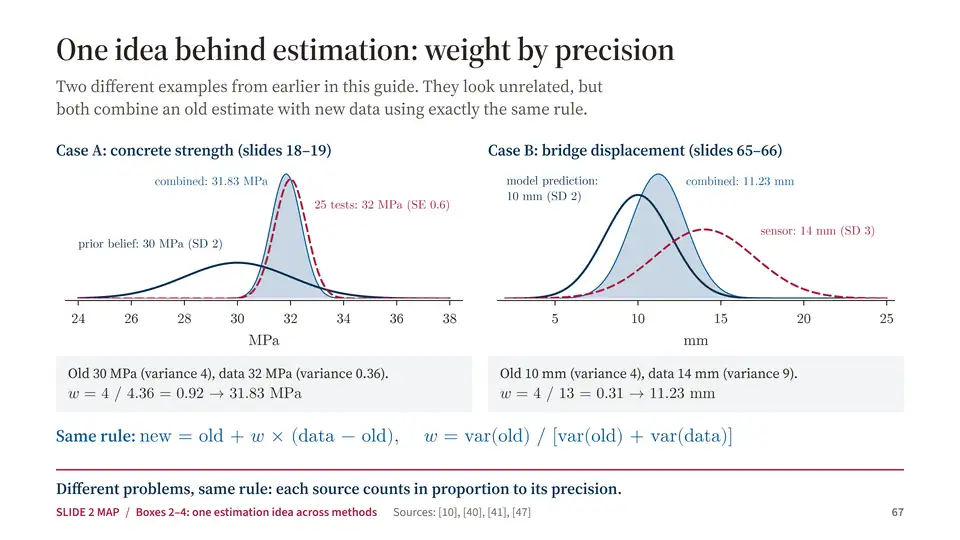
  66. Slide 65a: The Kalman loop: predict, observe, weigh, update
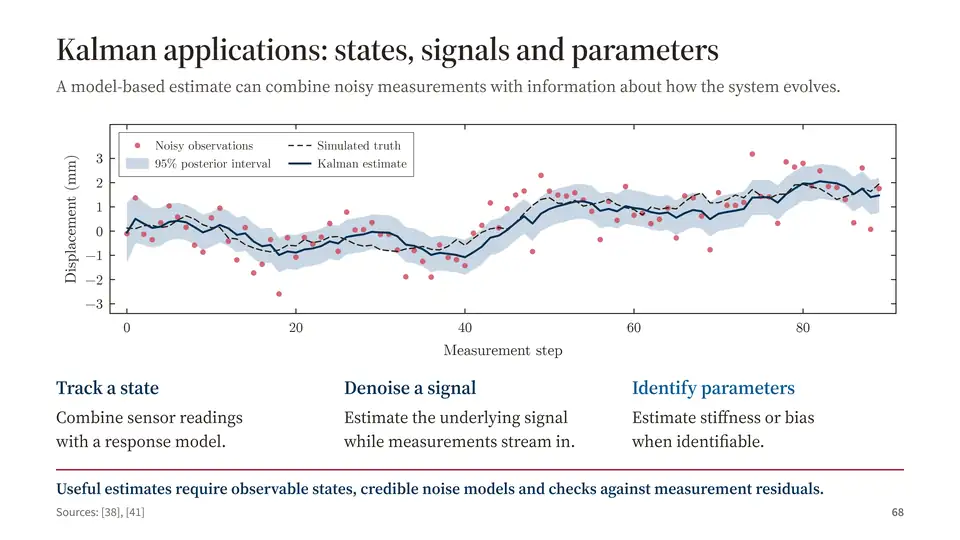
  67. Slide 66: One Kalman update, step by step
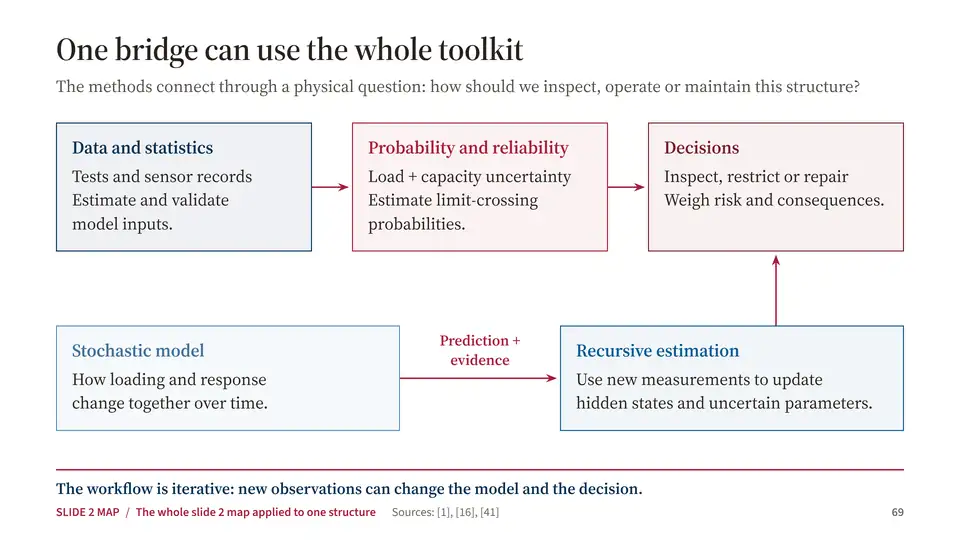
  68. Slide 67: One idea behind estimation: weight by precision
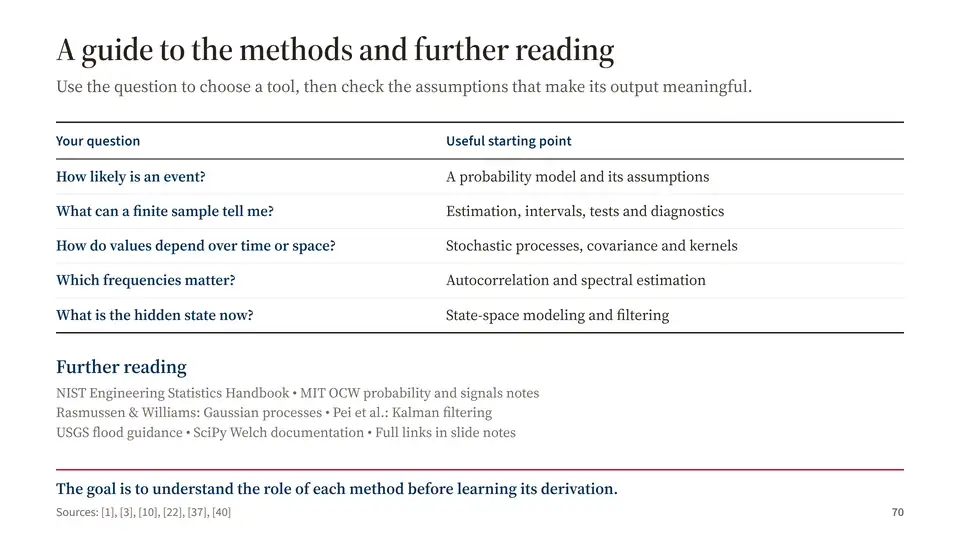
  69. Slide 68: Kalman applications: states, signals and parameters
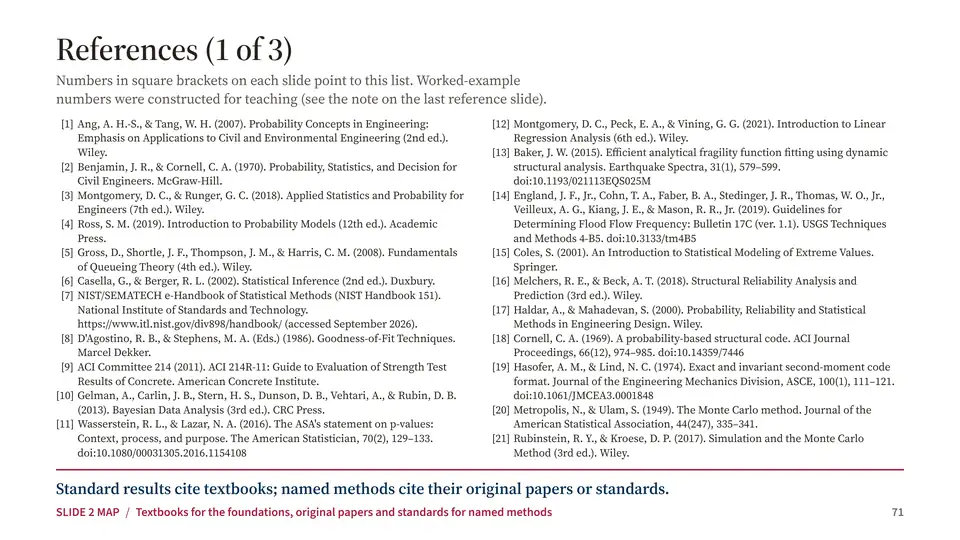
  70. Slide 69: One bridge can use the whole toolkit
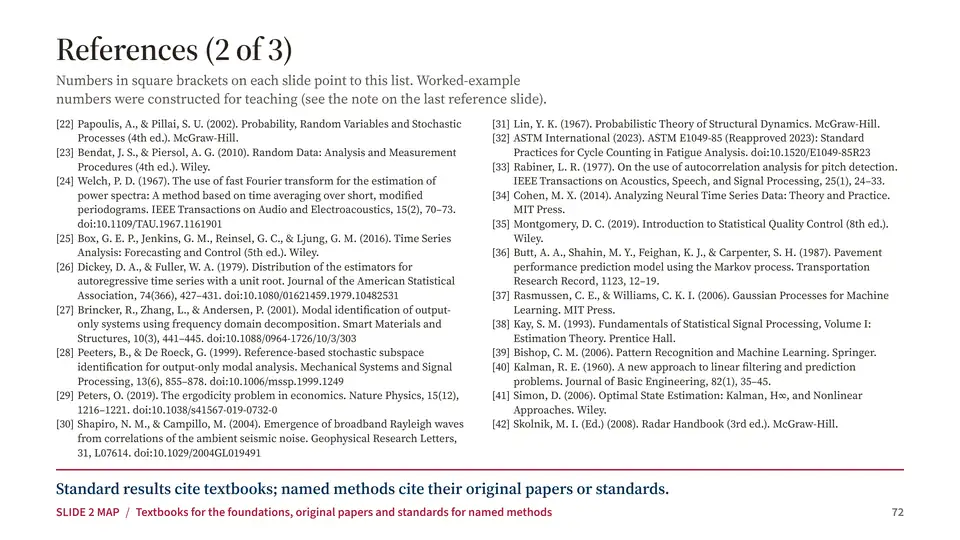
  71. Slide 70: A guide to the methods and further reading
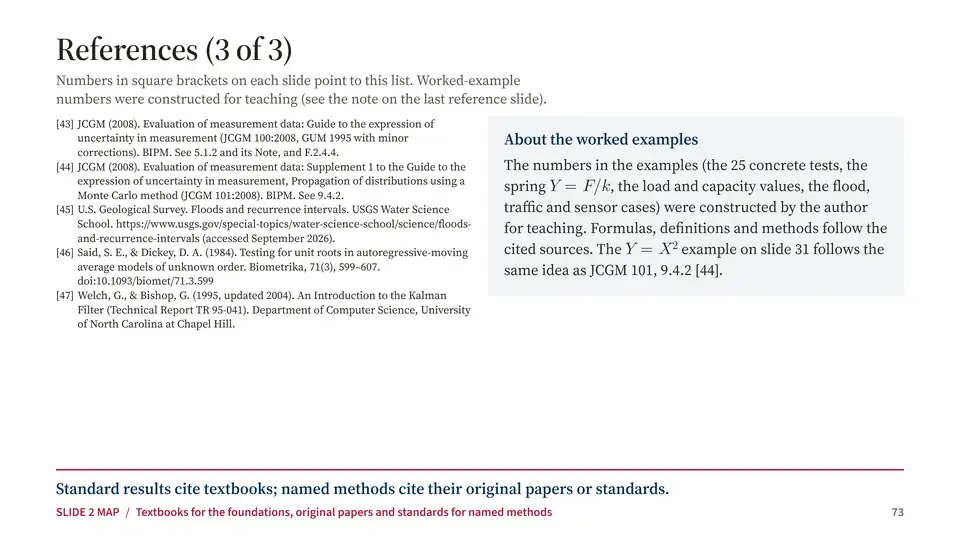
  72. Slide 71: References (1 of 3)
  73. Slide 72: References (2 of 3)
  74. Slide 73: References (3 of 3)
1 / 73